


Abstract
In this study, the sensitivity of the CB2 receptor to methanethiosulfonate (MTS) derivatives was tested, and a native cysteine residue conferring the sensitivity was identified. By incubating human embryonic kidney 293 cells stably transfected with CB2 receptors and MTS derivatives such as MTS ethylammonium (MTSEA), [3H]HU-243 binding was inhibited. Pretreatment of the CB2 receptor with cannabinoid ligands prevented this inhibition, suggesting that MTSEA modification occurred within the binding crevice. To identify the cysteine(s) responsible for the MTSEA sensitivity, 10 CB2 mutants were prepared in which the eight cysteines in transmembrane domains or extracellular loop 2 were mutated to serine or alanine, one at a time or in combination. Five mutants exhibited specific [3H]HU-243 binding, with Kd and Bmax values similar to those of wild-type CB2. However, five other mutants had no detectable ligand binding and were not detected on cell membranes by Western blot analysis. Among the five mutants with normal binding, only the sensitivity to MTSEA of the C2.59(89)S mutant was reduced significantly. These data demonstrate that C2.59(89) is the residue that mainly confers the inhibitory effect of MTSEA on ligand binding. Furthermore, the magnitude of the second-order rate constant (1.14 ± 0.28 M–1s–1) for the MTSEA reaction with wild-type CB2 suggests that C2.59(89) resides at the margin of the CB2 binding site crevice. The accessibility of C2.59(89) to MTSEA provides experimental evidence for a possible conformational difference between TMH2 of CB2 versus Rho. Modeling studies undertaken to explore the origin of such differences suggest it is possibly caused by the conformational influence of S2.54(84).
Cannabinoids are the group of C21 compounds typical of and present in the Indian hemp Cannabis sativa L. For centuries, hashish and marihuana, both derived from cannabis, have been used for their medicinal and psychotomimetic effects. However, the major sites of action for cannabinoids, namely the CB1 and CB2 receptors, were cloned just over a decade ago (Matsuda et al., 1990; Munro et al., 1993). Both of the cannabinoid receptors belong to the class A rhodopsin-like family of G protein-coupled receptors (GPCRs). CB1 is mainly located in the central nervous system, whereas CB2 is found mostly in peripheral tissues, such as immune cells (Matsuda et al., 1990; Munro et al., 1993). The design of cannabinoid (CB) receptor subtype specific agonists and/or antagonists has important therapeutic implications. For example, the use of CB2-specific agonists can avoid the side effects of cannabinoids on the central nervous system. A better understanding of the structure and function of CB1 and CB2 can provide a foundation that may ultimately facilitate the design of receptor subtype specific ligands.
A powerful strategy to probe the structure and function of a membrane protein is to introduce individual cysteines at various positions and then use different thiol-specific reagents to label the engineered cysteine(s), followed by assays of functional changes. The combination of cysteine substitution and covalent modification can be used to study the structure-function relationships and dynamics of protein activity (Farrens et al., 1996). An extension of this combination [i.e., the substituted cysteine accessibility method (SCAM)] was first developed by Karlin and Akabas to map the channel-lining residues in the nicotinic acetylcholine receptor (Karlin and Akabas, 1998). Thereafter, this method was adapted to map the ligand binding crevice of dopamine D2 receptor, β-adrenergic receptor, and other GPCRs (Javitch et al., 1994, 1995, 1997).
In the SCAM method, after establishing an appropriate background in which all reactive native cysteines are mutated to serine, each residue in the transmembrane helix (TMH) of interest is mutated to cysteine, one at a time. Thereafter, the mutant receptors are treated with methanethiosulfonate (MTS) reagents, and the influence of MTS reagents on ligand binding is tested. Three small and charged thiol-specific reagents, MTS ethylammonium (MTSEA), MTS ethyltrimethylammonium (MTSET) and MTS ethylsulfonate (MTSES), are used to react specifically with free sulfhydryl groups. The MTS reagents react 109 times faster with ionized thiolates than with un-ionized thiols (Roberts et al., 1986), and only water-accessible cysteines are likely to be ionized to a significant extent. In addition, MTSEA, MTSET, and MTSES are charged, hydrophilic reagents that are assumed to react much faster with water-accessible cysteine residues than with cysteines facing the protein interior or lipid. The reaction of an MTS reagent is inferred if binding of ligand is irreversibly affected (Javitch et al., 1999). An advantage of this method is that, by comparing the corresponding residues in the binding crevices of different receptor subtypes, such as D1 and D2 receptors, one can limit the candidate residues responsible for the specificity of certain ligands.
Because the CB receptors belong to the class A, rhodopsin-like family of GPCRs, it would be expected that the structures of the CB1/CB2 receptors and those of rhodopsin and other class A receptors, such as the dopamine D2 receptor, will bear many similarities. However, the amino acid sequences of the CB receptors have several critical divergences from the sequences of rhodopsin and the D2 receptor. The CB receptors lack prolines in TMH1 and TMH5 and lack the helix bending GGXTT motif in TMH2 of Rho. The disulfide bond between C3.25 and another cysteine at extracellular loop 2 is also absent in the CB receptors. These unique structural characteristics suggest that the binding crevice of CB receptors may be different from those of rhodopsin and the D2 receptors, for example. Thus, homology models for the CB receptors based strictly upon the crystal structure of Rho may miss important, unique features. For this reason, SCAM studies of the binding pockets of the CB receptors, should reveal important new information about the binding site crevices of the CB receptors.
The work reported here lays the foundation for future SCAM studies of the CB2 receptor. First, we established that the wild-type CB2 receptor is sensitive to MTS reagents and then through site-directed mutagenesis, we identified the cysteines in the TMHs conferring this sensitivity. Our results suggest a possible conformational divergence between CB2 TMH2 and that of Rho. The origin of this divergence is explored here using molecular modeling.
Materials and Methods
Materials
Anandamide and WIN55212-2 were obtained from RBI/Sigma (Natick, MA). HU-210 was obtained from Tocris (Ballwin, MO). CP-55940 and SR144528 were provided by the National Institute on Drug Abuse. [3H]HU-243 was purchased from Tocris. [3H]WIN55212-2 was purchased from PerkinElmer Life and Analytical Sciences (Boston, MA). MTS derivatives (Table 1), including MTSEA, MTSES, MTSET, methyl methanethiosulfonate (MMTS), and 2-hydroxyethyl methanethiosulfonate (MTSHE) were purchased from Toronto Research Chemicals (North York, ON, Canada). Dulbecco's modified Eagle's medium, fetal bovine serum, penicillin/streptomycin, glutamine, trypsin, and G-418 (Geneticin) were obtained from Cambrex Bio Science Walkersville, Inc. (Walkersville, MD). Enzymes and reagents used for recombinant DNA experiments were purchased from Invitrogen (Carlsbad, CA), or Promega (Madison, WI). Adenovirus-transformed human embryonic kidney (HEK) 293 cells were obtained from American Type Culture Collection (Manassas, VA). Glass tubes used for diluting cannabinoid drugs and for ligand binding assays were silanized by exposure to dichlorodimethylsilane (Sigma Chemical Co., St. Louis, MO) vapor while under vacuum for 3 h. Protein markers were purchased from Bio-Rad (Hercules, CA). Horseradish peroxidase-conjugated secondary antibodies and the enhanced chemiluminescence system for visualizing Western blot were purchased from Amersham Biosciences (Piscataway, NJ). Anti-CB2 polyclonal antibody was obtained from Cayman Chemical (Ann Arbor, MI). GF/B filters were purchased from Whatman International (Maidstone, UK).
The MTS reagents used in this study
Amino Acid Numbering System
The amino acid numbering system suggested by Ballesteros and Weinstein (1995) was used. Each amino acid identifier starts with the TMH number, followed by the amino acid position relative to a reference amino acid in that helix. This reference amino acid is the most highly conserved residue across G protein-coupled receptors in that helix and is assigned a locant value of 0.50. This numbering system for the cannabinoid receptor has been described previously (Bramblett et al., 1995). For example, the most highly conserved amino acid in TMH2 is aspartic acid. In the CB2 sequence, this is residue 80. Using the proposed numbering system, this amino acid would be called D2.50(80). The amino acid preceding the aspartic acid, an Ala, would be called A2.49(79).
Site-Directed Mutagenesis
A 1.8-kilobase full-length human CB2 gene was subcloned into pRC/CMV (Invitrogen, San Diego, CA) to construct the expression plasmid pHCB2-RC/CMV. Oligonucleotides synthesized by Integrated DNA Technologies, Inc. (Coralville, IA) were designed to generate the appropriate mutation and to introduce simultaneously a restriction site with a silent mutation. The GeneEditor in vitro site-directed mutagenesis system (Promega) was used to mutate the CB2 cannabinoid receptor. The mutants were identified by restriction mapping and confirmed by DNA sequencing. The eight cysteines in CB2 receptor subject to mutagenesis are highlighted as gray circles in Fig. 1.
Cell Culture
HEK293 cells were maintained in a humidified atmosphere at 37°C and 5% CO2 in Dulbecco's modified Eagle's medium containing 10% fetal bovine serum, 2 mM glutamine, 100 units/ml penicillin, and 100 μg/ml streptomycin. For stable transfection, HEK293 cells grown in 35-mm dishes to 70 to 80% confluence were incubated with 1.5 μg of wild-type or mutant CB2 receptor cDNA in 6 μl of Lipofectamine (Invitrogen) and 1 ml of OptiMEM (Invitrogen). Five hours after transfection, the solution was removed, and fresh culture medium was added. Twenty-four hours after transfection, the cells were passed into a 100-mm dish, and 800 μg/ml G-418 was added to select for stably transfected cells. The stably transfected pools of HEK293 cells were maintained in medium containing 400 μg/ml G-418.
Cell Harvesting
Cells were washed twice with phosphate-buffered saline containing 8.1 mM NaH2PO4, 1.5 mM KH2PO4, 138 mM NaCl, and 2.7 mM KCl, pH 7.2, and then dissociated in phosphate-buffered saline containing 1 mM EDTA. Dissociated cells were collected by centrifugation at 1000g for 5 min at 4°C. The cell pellets were resuspended in binding buffer (50 mM Tris-HCl, 200 mM sucrose, 5 mM MgCl2, 2.5 mM EDTA, and 0.5 mg/ml bovine serum albumin, pH 7.4) for treatment with MTS reagents and ligand binding assays.
Treatment with MTS Reagents
MTS reagents were always freshly prepared. All MTS reagents were dissolved in distilled water at 4°C except for MTSHE, which was dissolved in a 50% dimethyl sulfoxide solution. Aliquots (100 μl) of the cell suspensions were incubated with MTS reagents at the stated concentrations for 10 min at room temperature. Cell suspensions were then diluted 15-fold with binding buffer and centrifuged at 1000g for 5 min. After discarding the supernatant, the cell pellets were resuspended in binding buffer for ligand binding assays. For the ligand binding crevice protection experiments, the cells expressing wild-type CB2 receptors were preincubated with cannabinoid ligands at different concentrations for 40 min and then treated with MTSEA for 10 min at a concentration that causes 75% inhibition of ligand binding. After diluting with binding buffer and centrifugation at 1000g for 5 min at 4°C, the cell pellets were resuspended in fresh binding buffer and incubated for 10 min at 4°C. Thereafter, the cell pellets were again centrifuged at 1000g for 5 min at 4°C, resuspended in fresh binding buffer, and incubated for 10 min at 4°C. This process was repeated for four times to wash off the cannabinoid ligands. At the end of washing, the cells were resuspended in binding buffer for ligand binding assays.
Ligand Binding Assay
Cannabinoid ligands were diluted in binding buffer and then added into assay tubes. [3H]HU-243 (0.2 nM) was used as a radiolabeled ligand for competition binding assays. Nonspecific binding was determined in the presence of 1 μM unlabeled HU-210. Binding assays were performed in 0.5 ml of binding buffer for 60 min at 30°C. Free and bound radioligands were separated by rapid filtration through polyethylenimine-treated GF/B filters (Whatman International) with a Brandel cell harvester (Gaithersburg, MD). The filters were washed three times with 3 ml of ice-cold washing buffer (50 mM Tris-HCl and 1 mg/ml bovine serum albumin, pH 7.4) and equilibrated overnight in scintillation cocktail (Hydrofluor; National Diagnostics, Manville, NJ). The bound [3H]HU-243 was determined with a liquid scintillation counter.
Western Blot Analysis
Samples were incubated with 2× Laemmli buffer under reducing conditions at room temperature for 20 min, and proteins were resolved on a 10% SDS-polyacrylamide gel using an Invitrogen minigel electrophoresis system. Proteins were transferred onto a nitrocellulose membrane for immunodetection with a CB2 antibody. The nitrocellulose membranes were blocked with 5% nonfat dry milk in Tris-buffered saline/Tween 20 (TBS-T; 20 mM Tris, 137 mM NaCl, and 0.1% Tween 20, pH 7.6) for 1 h and then incubated overnight at 4°C with the primary antibody. Thereafter, the membranes were washed twice for 10 min each with TBS-T buffer and incubated with horseradish peroxidase-conjugated secondary antibody for 1 h at room temperature. The membranes were then washed three times with TBS-T buffer for 10 min each, and the antibody-recognized protein bands were visualized using an enhanced chemiluminescence kit.

Schematic representation of human CB2 receptor. The cysteines subject to mutagenesis in this study are highlighted as gray circles. The most highly conserved residue in each helix is highlighted in blue.
Determination of Second-Order Rate Constant
The second-order rate constant (KMTSEA) for the reaction of MTSEA with wild-type CB2 or each mutant was estimated according to the method used by Javitch et al. (1995). In brief, each receptor was incubated with different concentrations MTSEA for a fixed time. The results were fit to the equation: Y = (1 – plateau) e–kct + plateau. Y is the fraction of initial binding, plateau is the fraction of residual binding at saturating concentrations of MTSEA, k is the second-order rate constant (M–1 s–1), c is the concentration of MTSEA (molar), and t is the fixed time (seconds). This equation was transformed into the following form: –ln[(Y – plateau)/(1 – plateau)]/t = kc. After plotting –ln[(Y – plateau)/(1 – plateau)]/t against c, k was obtained as the slope.
Data Analysis
Data from the ligand binding assays were analyzed, and curves were generated with the Prism program (GraphPad Software, San Diego, CA). IC50 and EC50 values were determined by nonlinear regression analysis performed with the Prism program. Kd and Bmax values were estimated from competition binding experiments with the following equations: Kd = IC50 – L and Bmax = (B0IC50)/L, where L is the concentration of free radioligand, and B0 is specifically bound radioligand (DeBlasi et al., 1989). The Ki values were calculated based on the Cheng–Prusoff equation: Ki = IC50/(1 + L/Kd) (Cheng and Prusoff, 1973).
Molecular Modeling
Definition of Rotameric State of χ1. Different nomenclatures have been used to define the rotameric state of side-chain torsion angles. The nomenclature employed here for the χ1 torsion angle is that described by Shi et al. (2002). When the heavy atom at the γ position is at a position opposite the backbone nitrogen when viewed from the β-carbon to the α-carbon, the χ1 is described as trans. When the heavy atom at the γ position is at a position opposite the backbone carbon when viewed from the β-carbon to the α-carbon, the χ1 is described as gauche+ (g+). When the heavy atom at the γ position is at a position opposite the α-hydrogen when viewed from the β-carbon to the α-carbon, the χ1 is described as gauche– (g–). Using this nomenclature system, the side-chain conformations discussed here are categorized into g– (0° < χ1 < 120°), trans (120° < χ1 < 240°), or g+ (240° < χ1 < 360°).
Conformational Memories Study of TMH2 in CB2. The goal of the modeling studies reported here was to explore the possible reasons for the accessibility of C2.59(89) to MTSEA and the reduced accessibilities of other endogenous cysteine residues to MTSEA in CB2. In Rho, residue T2.59(92) [which corresponds to C2.59(89) in CB2] is located on the lipid face of TMH2. Although TMH2 in Rho has a helix-distorting GGXTT motif that CB2 TMH2 lacks, models of CB2 TMH2 modeled without a GGXTT motif still locate C2.59(89) on the lipid face of TMH2. We therefore sought an alternate motif or residue on TMH2 that might affect the conformation of TMH2 such that C2.59(89) was moved into the helix-helix interface or into the binding pocket of CB2. Both serines and threonines have been shown to be able to act as hinge residues to affect the conformation of an α helix via an intrahelical hydrogen bond between the Oγ atom of the Ser or Thr (in a g– or +60° χ1) and the i-3 or i-4 carbonyl oxygen of the helix backbone. This is of particular significance for membrane proteins (Ballesteros et al., 2000). CB2 TMH2 has serines at S2.39, S2.45, S2.54, and S2.60, but no threonine residues. S2.39 and S2.45 were not considered possible hinge residues because they are intracellular to D2.50, a highly conserved residue whose spatial position had to be maintained to preserve the important D2.50/N7.49 interaction in the TMH bundle. Residue S2.60 is extracellular to C2.59 and therefore would not be able to affect the position of C2.59. Therefore, S2.54 was chosen as the hinge residue for our calculations.
We explored the possible conformational consequences in CB2 TMH2 (R2.37-F2.67) of Ser2.54(84) adopting a g– χ1 by using the Monte Carlo/simulated annealing conformational memories (CM) method (Guarnieri and Weinstein, 1996). CM studies were also performed in parallel with Ser2.54(84) in a g+ χ1 and a trans χ1. The CM technique employs multiple Monte Carlo simulated annealing random walks using the Amber* force field as implemented in the Macromodel molecular modeling package (Mohamadi et al., 1990) (Schrödinger Inc., Portland, OR). ϕ and ψ values for helices with a serine residue in g–, g+, or trans from Ballesteros et al. (2000) were first incorporated into the TMH2 backbone using interactive computer graphics, and the resultant helix was input into CM. One hundred torsion angles of WT TMH2 were allowed to vary during the CM runs. These included the helix backbone ϕ and ψ for residues 2.40 to 2.65, as well as the amino acid side chain torsion angles for 2.37 to 2.67. The backbone ϕ and ψ values in the region of S2.54 (2.51–2.57) were allowed to vary ± 50°. All other backbone torsion angles were allowed to vary ± 10°. Side chain torsion angles were also allowed to vary ± 180° without constraints, with the following exceptions: the χ1 of S2.54 was set to g–, g+, or trans and was not varied during the runs. In the regions near the helix ends, β branching amino acid χ1 values were set to g+ and were not varied (I2.43, V2.62, and V2.66); in addition, the χ3-χ4 dihedrals on the last residue on the intracellular side (K2.37) were not varied. All calculations were performed using a distance-dependent dielectric. The calculation was performed in two phases as indicated below.
Exploratory Phase. In the exploratory phase, a random walk was used to identify the region of conformational space that is populated for each torsion angle studied. Starting at a temperature of 3000 K, 20,000 steps were applied to the rotatable bonds with cooling in 18 steps to a final temperature of 310 K. Trial conformations were generated at each temperature by randomly picking three torsion angles from the set of 100 and changing each angle by a random value within the range set in the calculation (see Conformational Memories Study of TMH2 in CB2). After each step, the generated trial conformation was either accepted or rejected using the Metropolis criterion. This calculation was repeated for a total of 100 cycles. Accepted conformations were used to map the conformational space of TMH2 by creating “memories” of values for each torsion angle that were accepted.
Biased Annealing Phase. In the second phase of the CM calculation, the only torsion angle moves attempted were those that would keep the angle in the “populated conformational space” mapped in the exploratory phase. The biased annealing phase began at a temperature of 722 K cooling to 310 K in 8 steps. 100 structures were written out at 310 K.
Analysis of Output. Finally, the output of 100 structures at 310 K was clustered using X-Cluster in MacroModel (Mohamadi et al., 1990). This program reorders the structures according to their root-mean-square deviation and groups the structures into families of similar conformers. The resulting 100 structures from each CM run were also analyzed using the program ProKink (Visiers et al., 2000). This program, which is embedded in the Simulaid Conversion program (Mezei, 2004) was used to calculate the face shift, wobble angle, and bend angle of each helix. A statistical analysis of the resultant face shift, wobble angle, and bend angle for the 100 helices from the S2.54(84) χ1 = g–, g+, and trans runs was performed using the Origin statistical analysis package (Version 7.0; OriginLab Corp., Northhampton, MA).
The criteria used to identify a helix for bundle incorporation were:
-
The helix retained D2.50(80) pointing toward N7.49(295) such that an intervening water could connect these two residues (this key interaction is seen in Rho).
-
The helix had no van der Waals overlaps with other TM helices in the bundle.
-
The extracellular end of TMH2 was close enough to the extracellular end of TMH3 to meet a distance criterion based upon the extracellular loop 1 (EC-1) length in Rho. Because the CB2 EC-1 loop (FHGVDS) contains the same number of residues as Rho (GYFVFG), we used the C-α distance of 16.8 Å in Rho between L2.66(99) and P3.22(107) as an approximate length for the EC-1 loop for CB2 and then allowed for ±1.0 Å about this value. All helices whose C-α carbons were between 15.8 and 17.8 Å from the C-α carbon of CB2 K3.22(103) were then identified.
-
It was required that the EC-1 loop attachment be possible without overtightening the TMH backbone that would cause van der Waals overlaps.
Model of Inactive State (R) Form of CB2. A model of the R form of CB2 was created using the 2.8-Å crystal structure of bovine rhodopsin (Rho) (Palczewski et al., 2000) as a starting point. First, the sequence of the human CB2 receptor (Munro et al., 1993) (see Fig. 1) was aligned with the sequence of bovine rhodopsin (Rho) using the same highly conserved residues as alignment guides that were used initially to generate our first model of CB1 (Bramblett et al., 1995). In the previous study, we used Fourier transform methods with the nPRIFT hydrophobicity scale and a variability profile to calculate the α periodicity in a set of receptors with high homology with CB1 (including CB2). The resultant profile was used to identify helical regions in the primary sequences as well as the ends of each helix. Because of the nature of the method, helical regions and helix ends identified were not just for CB1 but were also applied to the entire set of highly homologous sequences used (including CB2). TMH5 in CB1/CB2 lacks the highly conserved proline in TMH5 of Rho. Therefore, the sequence of CB1/CB2 in the TMH5 region was aligned with that of Rho as described previously using its hydrophobicity profile (Bramblett et al., 1995).
In our current CB2 model, initial helix ends for human CB2 were chosen in analogy with those of Rho (Palczewski et al., 2000). Except for TMH1, these helix ends were found to be within one turn of the helix ends that we originally calculated and reported in 1995 (Bramblett et al., 1995). One change dictated by the CB2 sequence was made in the helix ends. The break in helicity caused by the GWNC sequence motif (Barnett-Norris et al., 2004) on the extracellular end of TMH4 necessitated that TMH4 end at 4.62(170), followed by the GWXC motif (4.63–4.66) (Barnett-Norris et al., 2004) and the EC-2 loop beginning at C4.66. Changes to the general Rho structure that were necessitated by sequence divergences included the absence of helix-kinking proline residues in TMH1 and TMH5, the lack of a GGXTT motif in TMH2, as well as the possible difference in flexibility of TMH6 (Barnett-Norris et al., 2002). Modifications made to each of these helices are described below.
Our approach has been not to introduce distortions in any helix that lacks a proline or other helix-breaking motif, such as a GG, unless there is experimental evidence for the cannabinoid receptors suggesting that an alternate conformation would make more sense.
TMH1. TMH1 in CB2 lacks a Pro at 1.48(49) and therefore cannot be expected to have a proline kink. TMH1 of CB2 was modeled using the Rho coordinates intracellular to residue 1.48(49) and the extracellular portion of the helix was modeled using standard ϕ (–63°) and ψ (–41.6°) backbone dihedrals for TM helices (Ballesteros and Weinstein, 1995).
TMH2. As described above, the TMH2 conformer chosen for incorporation in our CB2 model emerged from our conformational memories study of the structural consequences of S2.54(84) acting as a hinge residue. The helix chosen to be incorporated into the CB2 model had a bend angle of 17.7°, a wobble angle of –66.3°, and a face shift of 20.2° (These values were calculated in ProKink (see below) using S2.54(84) as the hinge residue.)
TMH5. TMH5 in CB2 lacks the highly conserved P5.50 that is used as an alignment guide for most class A GPCRs. The sequence alignment for the TMH5 region of CB2 was taken from our original “structural alignment” of the CB1 and CB2 sequences, based on the predicted interior versus lipid-exposed character of the residues using their hydrophobicity profile (Bramblett et al., 1995). It is important to note that because TMH5 in CB2 lacks the proline at 5.50, the conformation and pitch of TMH5 will be different from that found in Rho. In Rho, the helix backbone loops out just above P5.50, causing a pitch change in TMH5 above residue 5.50. Because TMH5 in CB2 lacks a Pro at 5.50, no such pitch change will occur. For this reason, in our model of the CB2 inactive state, the Rho TMH5 structure intracellular to P5.50 was used to model TMH5 in CB1 and extracellular to 5.50, average backbone ϕ (–63.0°) and ψ (–41.6°) dihedral values found in TM helices were used to model the extracellular portion (Ballesteros and Weinstein, 1995).
TMH6. Because TMH6 figures prominently in the R to R* transition (Jensen et al., 2001), we have studied the conformations accessible to TMH6 in CB1 and CB2 using CM (Barnett-Norris et al., 2002). These studies revealed that TMH6 in CB1 (but not CB2) has high flexibility because of the small size of residue 6.49(357), a Gly immediately preceding Pro 6.50(358) in CB1. Less flexibility was found in the CB2 TMH6. For CB2, one cluster of conformers was found with an average bend angle of 24.6° (S.D. 4.3°). This cluster was used to obtain both a TMH6 for the inactive state of CB2 (a more kinked helix was used), and a conformer for the CB2 R* bundle (a less kinked helix was used) for the activated state (see below). For the R state, the TMH6 conformer was chosen (bend angle = 29.2°; wobble angle = 86.3°; face shift = –41.4°) so that R3.50(131) and D6.30(240) could form a salt bridge at the intracellular ends of TMH3 and TMH6 in the CB2 TMH bundle. An analogous salt bridge has been shown to be an important stabilizer of the inactive state of the β2 adrenergic receptor (Ballesteros et al., 2001a) and to be present in Rho (Palczewski et al., 2000).
Helix 8. The intracellular extension of TMH7, Hx 8 [E7.59(305)–W7.71(317)] was modeled in the same conformation seen in the Rho structure (Palczewski et al., 2000). The receptor was truncated after W7.71.
R to R* Transition in GPCRs. Because agonists are thought to have higher affinity for the activated form of GPCRs (Leff, 1995), agonist ligands in the work reported here were docked in a model of the activated state (R*) of CB2 (see below). This R* CB2 model was created by modification of our Rhodopsin-based model of the R form of CB2 (see above) and guided by the biophysical literature on the R to R* transition. This literature has indicated that GPCR activation is accompanied by rigid domain motion of the intracellular portion of TMH6 relative to TMH3 (Farrens et al., 1996; Ghanouni et al., 2001) and counter-clockwise rotations of TMH6 (Javitch et al., 1997) and TMH3 (Lin and Sakmar, 1996; Hulme et al., 1999) from an extracellular view.
Model of R* Form of CB2. Based upon experimental results for rhodopsin and the β2-adrenergic receptor (Farrens et al., 1996; Lin and Sakmar, 1996; Javitch et al., 1997; Ballesteros et al., 2001a; Jensen et al., 2001), the R* CB2 bundle was created from the R model of CB2 by rotating TMH3 so that residue 3.41(122) moves into the less hydrophobic environment of the TMH3–4 interface (Lin and Sakmar, 1996). This was accomplished by a 20° counterclockwise (extracellular view) rotation of TMH3 from its orientation in the R bundle. In the R* bundle, a less kinked TMH6 conformer from our TMH6 conformational memories study (bend angle, 17.2°; wobble angle, 114.3°; face shift, –15.6°) was substituted for the TMH6 conformer used in the inactive model of CB2 (Barnett-Norris et al., 2002). This conformer was chosen so that the salt bridge in the inactive state between R3.50(131) and D6.30(240) would be broken because of the movement of the intracellular end of TMH6 away from that of TMH3 and out into lipid (Ballesteros et al., 2001a). TMH6 was also rotated (counterclockwise from extracellular view) so that Cys 6.47(257) became accessible from inside the binding site crevice (Javitch et al., 1997).
Extracellular loops. Because the extracellular loops might be important in the studies reported here, these loops were added to the CB2 R* bundle. The EC-2 loop (Cys174–Asp188) is the largest extracellular loop in CB2. The conformation of this loop was calculated using the biased scaled collective variable in Monte Carlo method (Barnett-Norris et al., 2003) (Hassan et al., 2002). The aqueous environment of the EC-2 loop was modeled with a recently developed implicit solvent model that is based on a screened Coulomb potential formulation (the SCP-ISM) during the loop conformational analysis (Hassan et al., 2000a,b). This loop has an internal C4.66(174)-C179 disulfide bridge, one that has been suggested to be present in CB2 via mutagenesis studies (Gouldson et al., 2000). The shorter and less complex EC-1 [F2.67(97)–S3.21(102)] and EC-3 (T6.61(271)–K7.33(279)) loops were built using homology modeling with the EC-1 and EC-3 loops of Rho and then refined by energy minimization in the GB/SA model for water in Macromodel (see discussion of minimization protocol below).
Minimization Protocol.Preparation of helices. The N terminus and intracellular loops were not modeled in this study. For helices without loop segments, the helix was capped as the acetamide at its N terminus and/or as the N-methyl amide at its C terminus. Ionizable residues in the first turn of either end of the helix were neutralized, as were any lipid-facing charged residues. Ionizable residues were considered charged if they appeared anywhere else in the helix. Loop residues were considered fully charged in the first part of the minimization, which involved the GB/SA continuum model for water. Charges on loop residues were reduced in later stages of the calculation.
HU-243 conformation and docking position in CB2 R*. Because HU-243 is an agonist, docking studies were performed in the R* state model for CB2. The binding site conformation and anchoring interactions inside the receptor used for HU-243 were based on our published computational and experimental work and that of others. HU-243 was docked in the global minimum energy conformation for its tricyclic ring system (hexahydrocannabinol ring system) as determined by molecular mechanics conformational analysis (Reggio et al., 1993). Contrary to the documented importance of K3.28 to classic, nonclassic, and endogenous cannabinoid binding in CB1, as well as to diaryl pyrazole antagonist binding in CB1 (Song and Bonner, 1996, Hurst et al., 2002), K3.28 has been shown not to be important for ligand binding in CB2 (Tao et al., 1999). The EC-3 loop in CB2 (TTLSDQVKK) versus CB1 (GKMNKLIKT) has one important sequence divergence, a negatively charged residue in the center of the E-3 loop (Asp275; underlined). We have hypothesized that Asp275 forms a salt bridge with K3.28(109) in CB2, rendering K3.28 less available for ligand interaction. Rhee (2002) reported that in CB2, the IC50 of HU-243 increases from 1.2 ± 0.4 pM in WT to 15.3 ± 0.3 pM in an S7.39A mutant. For this reason, S7.39(285) was used as the primary interaction site for HU-243 in the R* model of CB2. Using this interaction as an anchoring interaction, the model was probed using interactive computer graphics for additional sites that could hydrogen bond with the pyran oxygen and with the carbocyclic ring CH2OH of HU-243. S2.60(90) was identified as an interaction site for the pyran oxygen of HU-243, whereas S6.58(268) was identified as an interaction site for the carbocyclic ring CH2OH of HU-243.
MTSEA conformation and interactions in CB2 R*. MTSEA was covalently linked to the thiol group of C2.59(89) such that a disulfide linkage was created, in accordance with the known reaction for MTS reagents and cysteine residues. Using interactive computer graphics, it was found that the MTSEA labeled group at C2.59(89) could extend such that its protonated amine R (R = –CH2CH2NH3+) group could form a salt bridge with Asp275 of the EC-3 loop. An energy minimization was then initiated from this starting conformation.
Energy minimization. The energy of the ligand/CB2 R* TMH bundle complex (or MTSEA-modified CB2 R* TMH bundle) was minimized using the AMBER* united atom force field in Macromodel 8.1. An 8.0-Å extended nonbonded cutoff (updated every 10 steps), a 20.0-Å electrostatic cutoff, a 4.0-Å hydrogen bond cutoff, and explicit hydrogens on sp2 carbons were used in each stage of the calculation.
Initial EC loop conformation refinement. The GB/SA continuum solvation model for water as implemented in Macromodel was used in the initial EC loop conformation refinement. This stage of the calculation consisted of 200 steps of Polak-Ribier conjugate gradient (PRCG) minimization in which a force constant of 240 kcal/mol was used on the helix backbone ϕ, ψ, and ω torsions to restrain the TMH backbones while permitting the extracellular loops to relax.
Bundle minimization. In the remaining stages of the calculation, a distance-dependent dielectric was used. The second stage consisted of two runs (500 steps each) of a PRCG minimization in which a force constant of 240 kcal/mol was used on the helix backbone ϕ, ψ, and ω torsions to restrain the TMH backbone conformation while permitting the ligand, side chains, and the EC loops to relax, and the TMH to move toward each other. The third stage of the calculation consisted of 3500 steps (seven runs of 500 steps each) of PRCG minimization in which the force constant on the helix and EC loop backbone torsions was held at 240 kcal/mol to allow the side chain torsions and ligand torsions to adjust, whereas the TMH backbones drew together but were gently slowed by fixed atom restraints with a force constant of 60 kcal/mol. In the fourth stage of the minimization, all fixed atom restraints were released, but the backbone torsions of the TMHs and EC loops were still restrained with a force constant of 240 kcal/mol until the bundle was minimized with a gradient of 0.1 kcal/(mol · Å2). All TMH backbone torsion restraints were then released, and only the EC loop backbone torsions were kept in place until a gradient of 0.1 kcal/(mole · Å2) was again reached. Coordinate snapshots were captured at the end of each stage, and run within each stage, for checking bundle integrity during the minimization. Energy minimizations of the CB2/MTSEA-modified system followed the same protocol.
Results
Time Course of the Effects of MTSEA on Specific Binding of [3H]HU-243 to Wild-Type CB2 Receptor. Because MTSEA is the most effective MTS reagent used for inhibition of ligand binding on other GPCRs (Javitch et al., 1994), we first tested the kinetic properties of MTSEA on the wild-type CB2 receptor. Four concentrations of MTSEA (1, 3, 10, and 30 mM) were used to treat the wild-type CB2 receptor expressed in HEK293 cells for 2, 5, 10, 20, and 30 min. With an increase of MTSEA concentration, the specific binding of [3H]HU-243 to the CB2 receptor was inhibited in a concentration-dependent manner by MTSEA at each time point. Treatment with MTSEA for 2 min substantially inhibited the specific binding of [3H]HU-243 to the CB2 receptor, especially at the high concentration of 30 mM. The inhibition of specific binding reached a plateau after a 10-min reaction (Fig. 2). Therefore, a 10-min treatment with MTS reagents was chosen for all the subsequent experiments.
Sensitivity of Wild-Type CB2 Receptor to MTSEA, MTSET, and MTSES. Specific [3H]HU-243 binding was not found in mock-transfected HEK293 cells, whereas HEK293 cells stably transfected with wild-type CB2 receptor had specific [3H]HU-243 binding, with Kd and Bmax values of 1.2 ± 0.4 nM and 3.8 ± 1.3 fmol/104 cells, respectively (Table 2). Treatment with increasing concentrations of MTSEA and MTSET caused a concentration-dependent inhibition of specific [3H]HU-243 binding to wild-type CB2. In contrast, treatment with MTSES caused no significant change of specific binding. In addition, CB2 was more sensitive to MTSEA than to MTSET (Fig. 3). Because MTSEA was the most effective in inhibiting specific binding among the three charged MTS reagents, this reagent was used for the subsequent tests of mutant CB2 receptors.
Parameters of [3H]HU-243 binding to wild-type and mutant CB2 receptors stably expressed in HEK 293 cells
Cells stably expressing the receptors were incubated with 0.2 nM [3H]HU-243, plus different concentrations (0.01 nM-1 μM) of HU-210 and assayed as described under Materials and Methods. Data were analyzed by one-site competition nonlinear regression performed with Prism software. Means ± S.E.M. are shown for n independent experiments, each performed in duplicate.
Protection of Ligand Binding Crevice from MTSEA Modification in Wild-Type CB2 Receptor. When wild-type CB2 receptor-expressing cells were preincubated with cannabinoid agonists WIN55212-2 and anandamide for 40 min, the inhibition of specific [3H]HU-243 binding by MTSEA decreased in a concentration-dependent fashion as the concentrations of cannabinoid agonists increased, demonstrating a concentration-dependent protection of [3H]HU-243 binding (Fig. 4). The inhibition of specific binding by MTSEA was totally blocked by approximately 1 and 10 μM WIN-55212-2 and anandamide, respectively.
Expression of Mutant CB2 Receptors on Cell Membranes. In this study, a total of 10 mutant CB2 receptors were made. Because the binding crevice of GPCRs for small ligands is thought to be among the transmembrane helices, cysteines in each TMH were mutated to serine. In addition, because EC-2 of cannabinoid receptors has been suggested to be involved in ligand binding, and the cysteines in TMH4 and EC-2 have been mutated to serines in previous studies (Gouldson et al., 2000), in the current study, these cysteines were mutated to alanine. Because C7.38(284) and C7.42(288) are in close proximity in TMH7, a double mutant C7.38(284)S/C7.42(288)S was made. Among the eight single mutants and the one double mutant, C1.39(40)S, C4.66(174)A, C175A, and C179A had no detectable binding, whereas C2.59(89)S, C6.47(257)S, C7.38(284)S, C7.42(288)S, and C7.38(284)S/C7.42(288)S had specific binding with Kd and Bmax values similar to those of wild-type CB2 receptor (Table 2). To determine whether there is any synergistic interaction between the cysteines, we combined the four single mutants, C2.59(89)S, C6.47(257)S, C7.38(284)S, and C7.42(288)S, each of which kept the normal ligand binding individually, and made a quadruple mutant C2.59(89)S/C6.47(257)S/C7.38(284)S/C7.42(288)S. Unfortunately, this quadruple mutant had no detectable ligand binding.

Time course of the effects of MTSEA on specific [3H]HU-243 binding to wild-type CB2 receptor. HEK293 cells stably transfected with wild-type CB2 receptor were treated with 1 (○), 3 (•), 10 (□), or 30 mM (▪) MTSEA for the indicated times at room temperature. [3H]HU-243 binding was determined as described under Materials and Methods. Each point represents the mean ± S.E.M. of three independent experiments, each performed in duplicate.
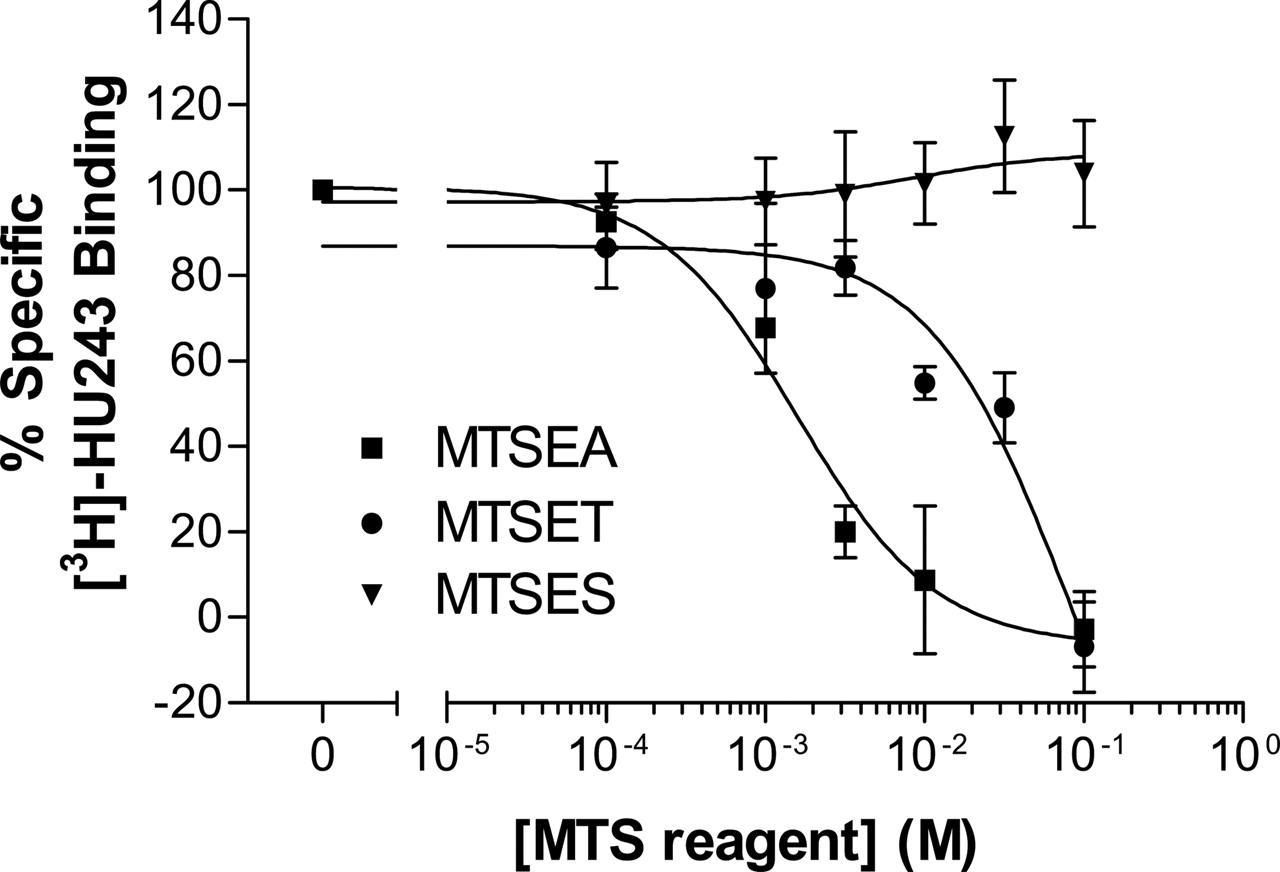
Effect of charged MTS reagents on specific [3H]HU-243 binding to wild-type CB2 receptor. HEK293 cells stably transfected with wild-type CB2 receptor were treated with MTSEA (▪), MTSET (•), or MTSES (▾) at the indicated concentrations for 10 min at room temperature. Each point represents the mean ± S.E.M. of at least three independent experiments, each performed in duplicate.

Protection by cannabinoid ligands against MTSEA effects on specific [3H]HU-243 binding to wild-type CB2 receptor. HEK293 cells stably transfected with wild-type CB2 receptor were preincubated with the indicated concentrations of WIN55212-2 (•) or anandamide (○) for 40 min at room temperature and then reacted with 5 mM MTSEA for 10 min at room temperature. Thereafter, the cells were washed five times, resuspended in binding buffer, and assayed for specific [3H]HU-243 binding. Each point represents the mean ± S.E.M. of at least three independent experiments; each performed in duplicate.
There are two possible reasons for the absence of detectable binding of the mutant receptors: 1) these mutants are not expressed on cell membranes or 2) these mutants are expressed on the membranes but have lost their ability to bind ligands. To examine the expression of CB2 mutants on cell membranes, Western blot experiments were performed with a CB2 antibody (Fig. 5). Wild-type CB2 and five mutants, C2.59(89)S, C6.47(257)S, C7.38(284)S, C7.42(288)S, and C7.38(284)S/C7.42(288)S, had the protein bands at a correct size of approximately 44 kDa. The expression levels of these receptors were similar, which was consistent with their Bmax values (Table 2). With membrane preparations of the other five mutants that had no detectable binding, the 44-kDa protein bands were not detected by CB2 antibody (Fig. 5). However, in the supernatant of whole-cell lysate of the HEK293 cells expressing these mutants, we detected the correct protein bands with the CB2 antibody (data not shown). This suggests that these five mutant CB2 receptors could not be correctly targeted onto membranes, although they were expressed in the cells. Therefore, only the five mutants with the normal membrane expression and ligand binding affinity were subsequently tested for the effect of MTSEA modification on specific [3H]HU-243 binding.
Effect of MTSEA on the CB2 Mutants. With the treatment of increasing concentrations of MTSEA, mutant receptors C6.47(257)S, C7.38(284)S, and C7.42(288)S had ligand binding inhibitions similar to those of wild-type CB2 receptor, with specific [3H]HU-243 binding decreased to almost 0% at 10 mM MTSEA. The double mutant receptor C7.38(284)S/C7.42(288)S responded to MTSEA similarly to wild-type CB2. In contrast, specific ligand binding to the mutant receptor C2.59(89)S was much less sensitive to MTSEA treatment. At 10 mM MTSEA, the mutant receptor C2.59(89)S retained approximately 60% of specific binding. (Fig. 6). MTSEA inhibited 50% of specific [3H]HU-243 binding to wild-type, C6.47(257)S, C7.38(284)S, C7.42(288)S, and the double mutant C7.38(284)S/C7.42(288)S CB2 receptors at concentrations of approximately 1.7, 0.5, 2.0, 0.8, and 1.3 mM, respectively. In contrast, with the C2.59(89)S mutant, MTSEA inhibited 50% of specific [3H]HU-243 binding at a concentration of 13.5 mM.
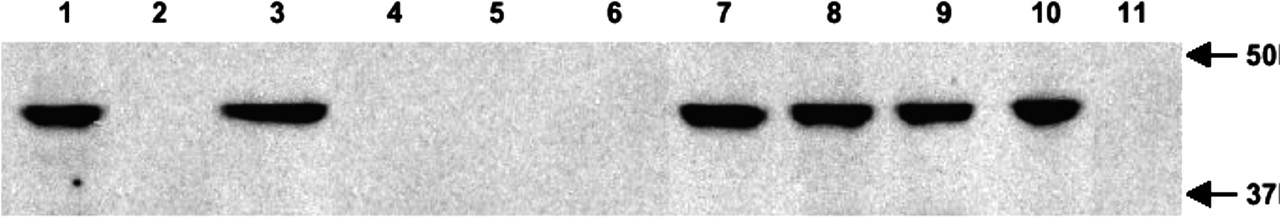
Western blot analysis of the expression of wild-type and mutant CB2 receptors on HEK293 cell membranes. Lane 1, wild-type CB2; lane 2, C1.39(40)S; lane 3, C2.59(89)S; lane 4, C4.66(174)A; lane 5, C4.67(175)A; lane 6, C179A; lane 7, C6.47(257)S; lane 8, C7.38(284)S; lane 9, C7.42(288)S; lane 10, C7.38(284)S/C7.42(288)S; lane 11, C2.59(89)S/C6.47(257)S/C7.38(284)S/C7.42(288)S. Molecular mass markers are shown at right.

Comparison of the effects of MTSEA on specific [3H]HU-243 binding to wild-type and mutant CB2 receptors. HEK293 cells stably transfected with wild-type (▪), C2.59(89)S (▴), C6.47(257)S (▾), C7.38(284)S (♦), C7.42(288)S (•), and C7.38(284)S/C7.42(288)S (□) mutant CB2 receptors were treated with MTSEA at the indicated concentrations for 10 min at room temperature, and specific [3H]HU-243 binding was determined as described under Materials and Methods. Each point represents the mean ± S.E.M. of at least four independent experiments, each performed in duplicate.
The second-order rate constants for the reaction of MTSEA with WT CB2 and the C2.59(89)S, C6.47(257)S, C7.38(284)S, C7.42(288)S and C7.38(284)S/C7.42(288)S mutants were estimated according to the method used by Javitch et al. (1995). KMTSEA for wild-type CB2 and the CB2 mutants C2.59(89)S, C6.47(257)S, C7.38(284)S, C7.42(288)S and C7.38(284)S/C7.42(288)S were determined to be 1.14 ± 0.28, 0.24 ± 0.06, 0.98 ± 0.16, 0.86 ± 0.22, 1.00 ± 0.28, and 1.22 ± 0.30 M–1s–1, respectively (Table 3).
The rate of reaction of MTSEA with wild-type CB2 and CB2 mutants
The second-order rate constant (KMTSEA) was estimated from data in Fig. 6 with equations described under Materials and Methods.
The kinetics results for the mutants in Table 3 indicate that the WT CB2 reactivity is 1.14 ± 0.28 M–1s–1 and that only the C2.59(89)S mutation had a statistically significant (P < 0.01 Student's t test) effect (a deleterious one) on the reactivity of CB2 with MTSEA. The constant values for all other mutants were not significantly different from WT (P > 0.05). These results suggest that C2.59(89) is the residue that is primarily labeled by MTSEA in WT CB2. Furthermore, the magnitude of the rate of the reaction between MTSEA and C2.59(89) suggests that this residue may not face directly into the water-accessible binding site crevice; rather, it is likely that this residue is at the margin of the water accessible binding site crevice (see Discussion).
Testing the Microenvironment around the Cysteine 2.59(89). The above results suggested that the inhibitory effect of MTSEA on ligand binding is conferred mainly by C2.59(89). The different inhibitory potencies of the three charged MTS reagents should be attributed to the microenvironment around this cysteine. To further test the microenvironment around C2.59(89), two neutral MTS reagents (Table 1), MMTS (which is smaller than MTSEA) and MTSHE (which similar in size to MTSEA) were used. Like MTSES, MMTS and MTSHE did not affect the specific [3H]HU-243 binding (Fig. 7).
There are two possible reasons for this lack of effect on ligand binding after MTS reagent treatment: 1) inaccessibility of the MTS reagent to C2.59(89) or 2) inability to block the ligand binding after covalent linkage of the MTS reagent to this cysteine. To differentiate between these two possibilities, wild-type CB2 receptor was pretreated with the highest concentration of MMTS, MTSHE, or MTSES used, followed by MTSEA treatment (Fig. 8). Preincubation with 0.1 M MTSES followed by treatment of MTSEA gave a result similar to that of the treatment of MTSEA alone (Fig. 8A). This suggests that MTSES could not approach and covalently link to the cysteine, thus allowing the unmodified cysteine to react with MTSEA. Pretreatment of cells with two neutral MTS reagents, MMTS and MTSHE, blocked the inhibitory effects of MTSEA on specific ligand binding. These data indicate that MMTS and MTSHE, unlike MTSES, could react with the cysteine, thus blocking the reaction of MTSEA with cysteine (Fig. 8, B and C).
Molecular Modeling. The goal of the modeling studies reported here was to explore the possible reasons for the accessibility of C2.59(89) to MTSEA and the reduced accessibilities of other endogenous cysteine residues to MTSEA in CB2. Modeling began with a consideration of the possible conformations of TMH2 in CB2 dictated by its sequence. These studies then led to a refined model of the CB2 R* state in which ligand binding and MTS reagent modification could be studied.

The effects of two neutral MTS reagents on specific [3H]HU-243 binding to wild-type CB2 receptor. HEK293 cells stably transfected with wild-type CB2 receptor were treated with MMTS (□) or MTSHE (•) at the indicated concentrations for 10 min at room temperature. Each point represents the mean ± S.E.M. of at least three independent experiments, each performed in duplicate.
TMH2 Conformational Memories Results. The reactivity of C2.59(89) (KMTSEA = 1.14 ± 0.28 M–1s–1) suggests that this residue probably resides at the margin of the binding site crevice of CB2 (see Discussion). This result is striking because the corresponding residue in Rho [T2.59(92)] clearly faces out into lipid (Palczewski et al., 2000). We undertook a conformational analysis of TMH2 in CB2 using the method of conformational memories to investigate possible conformational divergences between TMH2 in CB2 versus Rho that might explain the accessibility of C2.59 to MTSEA. Many GPCRs contain a proline residue in TMH2 at position 2.58 or 2.59 (Mirzadegan et al., 2003) that probably causes a bend in TMH2. Although TMH2 of bovine rhodopsin has no Pro, it does contain a significant bend (kink) within the 2.56 to 2.60 helix turn defined by Gly-Gly-X-Thr-Thr. In this motif, the side chains of the Thr hydrogen-bond to the carbonyls at the (i-4) positions, stabilizing a bent conformation with the Gly residues, probably adding flexibility and further facilitating a bent helix (Ballesteros et al., 2001b). TMH2 in CB2 lacks the Gly-Gly-X-Thr-Thr motif and also lacks a Pro. Thus, if the conformation of CB2 TMH2 is to deviate from regular α-helicity, different amino acids or alternate microdomains would need to be present in the TMH2 sequence. This residue or microdomain would need to be extracellular to D2.50 but before residue 2.59 (the location of the cysteine being labeled by MTSEA).

Comparison of three MTS reagents that have no inhibition on specific [3H]HU-243 binding to wild-type CB2 receptor. HEK293 cells stably transfected with wild-type CB2 receptor were pretreated with 0.1 M MTSES (A), MMTS (B), and MTSHE (C) for 10 min at room temperature. After washing, the cells were then reacted with MTSEA at the indicated concentrations for 10 min at room temperature. Specific [3H]HU-243 binding was determined as described under Materials and Methods. For comparison, the results obtained with cells treated with MTSES (▾), MMTS (♦), MTSHE (•), and MTSEA (▪) alone are plotted together with data from combination treatment experiments (open symbols). Each point represents the mean ± S.E.M. of at least three independent experiments, each performed in duplicate.
Both serines and threonines have been shown to be able to affect the conformation of an α helix via an intrahelical hydrogen bond between the Oγ atom of the Ser or Thr (in a g– (+60°) χ1) and the i-3 or i-4 carbonyl oxygen of the helix backbone. This is of particular significance for membrane proteins (Ballesteros et al., 2000). CB2 TMH2 has serines at S2.39(69), S2.45(75), S2.54(84), and S2.60(90), but no threonine residues. S2.39(69) and S2.45(75) were not considered possible hinge residues because they are intracellular to D2.50(80), a highly conserved residue whose spatial position had to be maintained to preserve the important D2.50/N7.49 interaction in the TMH bundle. Residue S2.60(90) is extracellular to C2.59(89) and therefore would not be able to affect the position of C2.59. Therefore, S2.54(84) was chosen as the hinge residue for our calculations in which we tested the hypothesis that S2.54(84) in a g– (+60°) χ1 forms an intrahelical hydrogen bond that produces an alteration from normal α-helicity in CB2 TMH2, which allows C2.59(89) to become accessible to MTSEA.
To test our hypothesis, we performed TMH2 conformational analyses with the hinge residue, S2.54(84) χ1 set to g–, g+, and trans using the conformational memories program (Guarnieri and Weinstein, 1996). Each set of 100 helices that resulted from our conformational memories studies were sorted on the basis of root-mean-square deviation from the first structure in each set by X-cluster analysis. X-cluster analysis revealed a single family of helices for each set. The ProKink program was used to analyze the bend angle, face shift, and wobble angle of each set of output. The results of this analysis are summarized in Table 4. As is evident in Table 4, CM results indicated that the TMH2 wobble angles varied over a wide range. This is probably caused by the small size of the residue [A2.53(83)] preceding the hinge residue S2.54(84). A two-sample independent t test was used to analyze the means of the bend angle, wobble angle, and face shift for the S2.54(84) g– χ1, g+ χ1, and trans χ1 run. This test revealed that, at the p = 0.05 level, the differences of the population means between the g– χ1 run and the g+ χ1 run wobble angles and between the g– χ1 run and the trans χ1 run wobble angles were significantly different from the test difference. No statistically significant differences were found for the bend (kink) angle or face shift between the g– χ1 run and the g+ χ1 run or the trans χ1 run.
ProKink analysis of conformational memories output
Values are presented as mean ± S.E.M.
Reciprocal mutation studies of D2.50(80), the most highly conserved residue in TMH2 and N7.49(295), part of the NPXXY motif in TMH7, have suggested that these two residues are adjacent in space and may interact in the TMH bundle of GPCRs (Zhou et al., 1994). The Rho crystal structure shows that these two residues interact via a bridging water molecule (Palczewski et al., 2000). Because one of the TMH2 helices from the CM runs was to be used in our CB2 R* bundle and because the D2.50(80)/N7.49(295) interaction is a key interaction that should be maintained in this bundle, the three sets of 100 helices were superimposed from A2.47(77) to D2.50(80) to compare the populations of TMH2s. Figure 9 illustrates the resultant superposition.
The strength of the CM method is that it allows one to sample low free-energy conformations of a helix and to assess the ability of a helix-distorting residue (Pro, Gly, or, in this case, Ser) to affect the conformation of that helix. The limitation of the method is that the calculation is performed on an isolated helix, but the helix needed for the studies here is one that will be part of a TMH bundle and therefore must meet several steric constraints imposed by the receptor. Figure 9 illustrates the 100 helices each from the g–, g+, and trans CM runs superimposed from D2.50(80) to the turn preceding it [i.e., to A2.47(77)]. Criterion 1 for the identification of helices appropriate for incorporation into the CB2 bundle was that the helix retained D2.50(80) pointing toward N7.49(295) such that an intervening water could connect these two residues (this key interaction is seen in Rho). All 100 helices of the g–, g+, and trans sets met criterion 1 by default, in that the helices were all superimposed at D2.50 in the analysis. All one hundred helices from the g–, g+, and trans runs also met criterion 2; i.e., they could be incorporated into the helix bundle without van der Waals overlaps with other TMH helices. Criterion 3 imposed a distance criterion based upon the length of the EC-1 loop in Rho. In Fig. 9, all helices within 1 Å of the yellow arc met this distance criterion. These helices are accentuated in the figure by a ball at the last C-α carbon of each. Six g–, fifteen g+, and eight trans helices met this criterion. The final and most stringent criterion used to select helices appropriate for the study required that the EC-1 loop attachment be possible without overtightening of the helix ends (which caused van der Waals overlaps). In particular, TMH3 in CB2 acted like a restraining hinge because of van der Waals overlaps that prevented the EC-1 loop from accommodating any TMH2 helix that tilted away from the TMH bundle or toward TMH1. This eliminated all but two of the helices (one from the g– run and one from the g+ run) from the CM output. These are circled in Fig. 9. In both of these helices, C2.59 was located in the TMH2–3 interface. The helix finally chosen for bundle incorporation was the g– helix because it brought C2.59 closer to the binding site crevice. This helix had a bend angle of 17.7°, a wobble angle of –66.3°, and a face shift of 20.2° When this conformer was incorporated into the TMH bundle, the hinge residue S2.54(84) was found to be located in the TMH1–2 interface with A1.47(48) adjacent on TMH1. This helix-helix environment for S2.54(84) combined with the lack of a hydrogen-bonding partner on TMH1 would be very conducive to the formation of an intrahelical hydrogen bond, as was initially hypothesized. In this location, S2.54(84) in a g– χ1 hydrogen bonds to the carbonyl oxygen located i-3 to this residue. The changes in the TMH2 backbone conformation produced by S2.54(84) in a g– χ1 were extracellular to D2.50(80), permitting, for example, C2.59(89) to be located in the TMH2–3 interface and S2.60(90) to face into the binding site crevice. Figure 10 illustrates the position of C2.59(89) in TMH2 of CB2 relative to the position of the corresponding residue in Rho, T2.59(92).
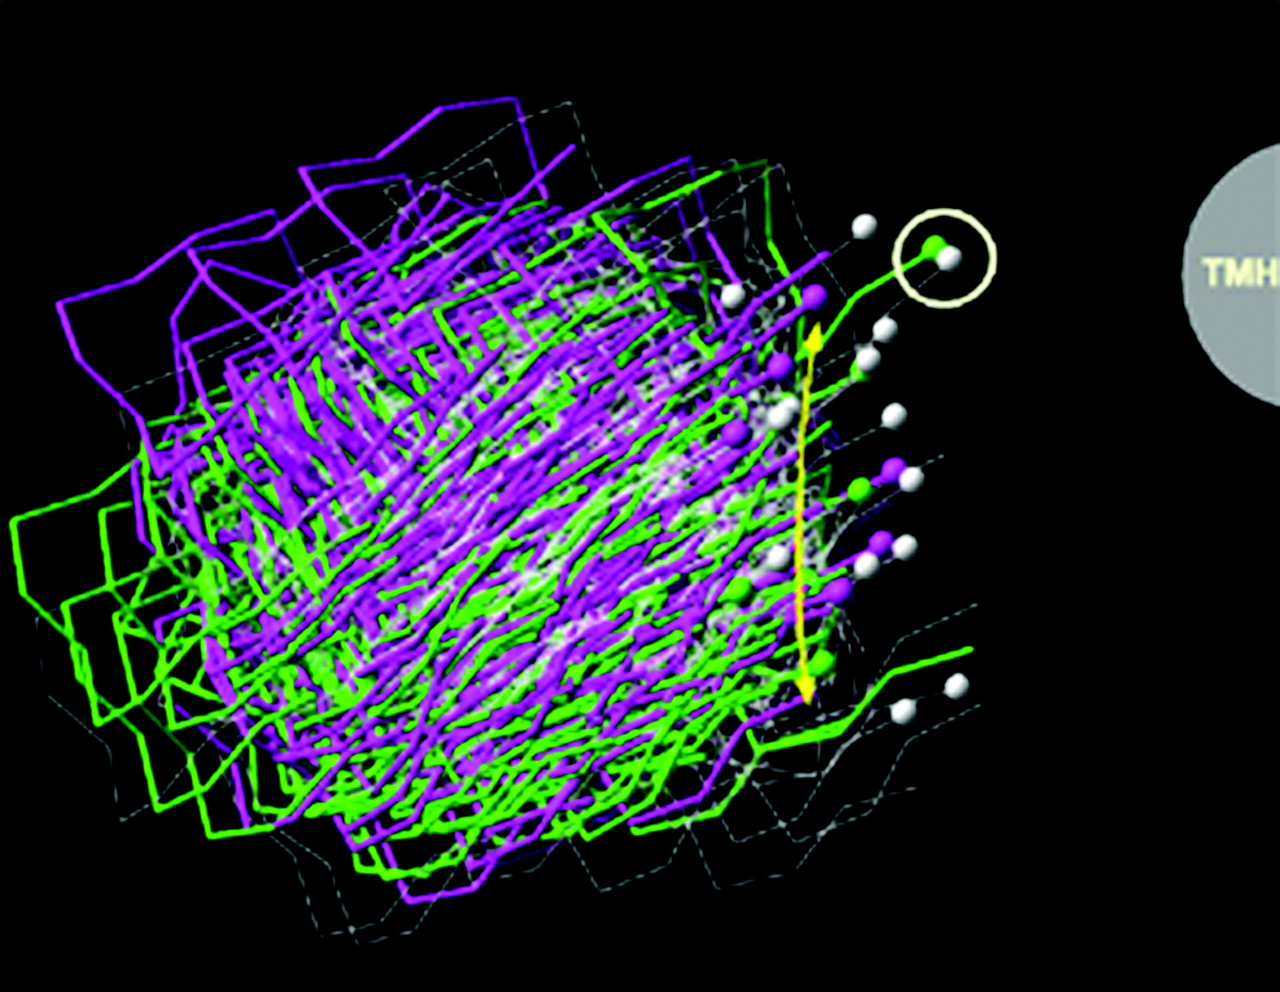
An extracellular view of the 100 TM 2 helices from the g– (green), g+ (white), and trans (purple) conformational memories runs is illustrated here. These helices were superimposed from A2.47(77) to D2.50(80) to assure that the helix ultimately selected for bundle incorporation would maintain the correct orientation of D2.50(80) relative to N7.49(295). The gray half-circle on the right indicates the position of TMH3 relative to the superimposed TMH2 conformers. All TM 2 helices within 1Å of the yellow arc met the distance constraint imposed by the length of the EC-1 loop (criterion 3; see Materials and Methods). These helices are accentuated in the figure by a ball at the last C-α carbon of each. The final and most stringent criterion used to select helices appropriate for the study required that the EC-1 loop attachment be possible without overtightening of the helix ends (causing van der Waals overlaps). The two helices that met this final criterion are circled in white here.
Probe of CB2 R* Bundle for Native Cysteines Susceptible to MTS Reagent Modification. The CB2 receptor has eight native cysteines in the extracellular loop or transmembrane regions: C1.39(40), C2.59(89), C4.66(174), C175, C179, C6.47(257), C7.38(284), and C7.42(288).
Extracellular loop cysteines. C4.66(174) is the final residue in the GWXC [G4.63(171)–C4.66(174)] motif before the beginning of the EC-2 loop (Barnett-Norris et al., 2004). The EC-2 loop of CB2 contains two cysteines, Cys175 and Cys179. In the present study, C4.66(174), Cys175, and Cys179 were mutated to alanine. The mutant receptors were unable to bind ligands and were found not to be expressed on cell membranes. Gouldson et al. (2000) reported that mutation of C4.66(174) or Cys179 to serine resulted in a receptor that was expressed on the cell surface but failed to bind ligand. They also reported that a Cys175 mutation to serine resulted in WT binding of CP55940 but a complete loss of binding of SR144528. These results have been taken as evidence of a disulfide bridge formed between Cys174 and Cys179 in the EC-2 loop of CB2. Our biased scaled collective variable in Monte Carlo study of the CB2 R* EC-2 loop has indicated that when C4.66(174) and C179 form a disulfide bridge, residue Cys175 does not face down into the ligand binding pocket; rather, it faces up toward the extracellular space near the top of TMH4 or the tops of TMH4 and TMH5 (Barnett-Norris et al., 2003). Thus, C4.66(174) and Cys179 would probably not be accessible to MTS reagents, and Cys175 would probably react with MTSEA, but this reaction would have no effect on ligand binding.
Transmembrane Cysteines. The mutation C2.59(89)S reduces the reactivity of MTSEA (KMTSEA) from 1.14 ± 0.28 to 0.24 ± 0.06 M–1s–1. This was the only mutation for which the reactivity of MTSEA was statistically different from WT. This result suggests that C2.59(89) is the primary native cysteine labeled by MTS reagent. In our CB2 model, C2.59(89) is located in the TMH2–3 interface and is not blocked by another residue, meaning that it is available for reaction with MTS reagents. In addition to C2.59(89), four other native cysteines in the transmembrane region face into the binding pocket An inspection of the CB2 R* model suggests that the accessibility to MTS reagents of transmembrane cysteines other than C2.59(89) may be reduced, however, by intervening residues in the binding site crevice. C1.39(40) faces into the binding pocket between TMH2 and TMH7, but M7.40(286) sterically blocks this residue. C2.59(89) is at the same level as C7.38(284) in the binding pocket. C7.38(284) is one turn extracellular to C7.42(288). C6.47(257) is one turn below C7.42(288), so C6.47(257) is fairly deep in the binding pocket. C6.47(257) has been shown to change accessibility upon activation of the β-2-adrenergic receptor, becoming accessible within the binding pocket only in the activated state (Javitch et al., 1997). In our CB2 model, this residue faces lipid in the inactive state and is located in the TMH6–7 interface in the activated state. In the CB2 activated state model, however, N7.45(291) partially blocks C6.47(257), such that C6.47(257) should be less available for reaction with MTS reagents. This is the situation with the two Cys residues on TMH7 as well. In the model, C7.38(284) and C7.42(288) are located in the TMH6–7 interface. L6.54(264) tends to be in front of C7.38(284) in the binding site crevice, blocking this residue and making it less accessible for modification by MTS reagent. L6.54(264) is also on top of C7.42(288), whereas F3.36(117) is tucked up against C7.42(288), reducing the accessibility of C7.42(288) to MTS reagents as well. Thus, the four other native cysteines in the transmembrane region that face into the binding pocket may be less accessible to MTSEA because of steric hindrance produced by surrounding residues.
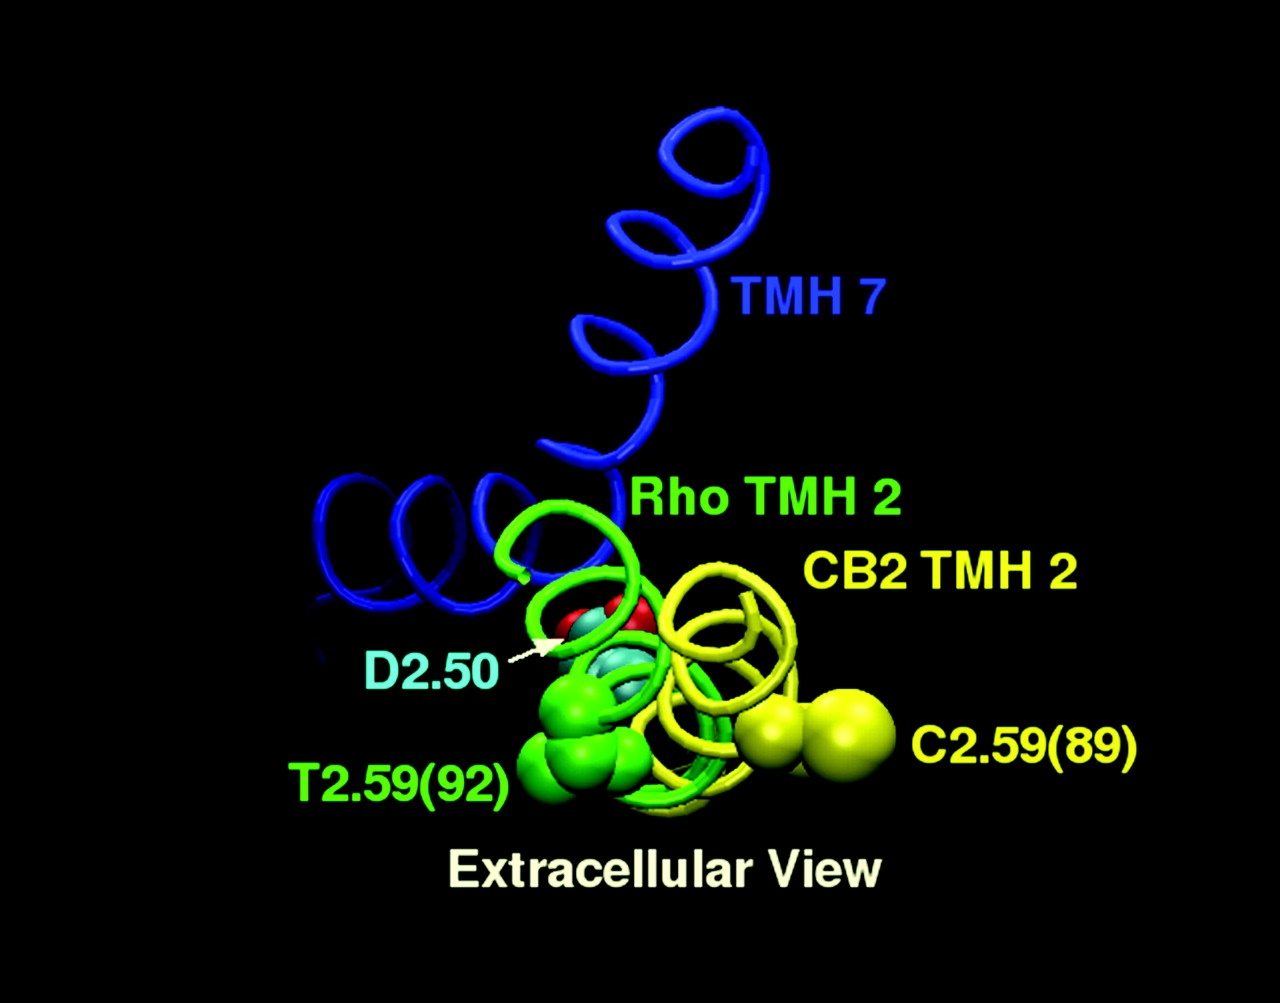
A comparison is provided here of the relative positions of residue 2.59 in TMH2 of Rho versus TMH2 of CB2 (as predicted by the conformational memories calculations reported here). TMH2 of Rho and TMH2 of CB2 have been superimposed at their intracellular ends to D2.50. It is clear here that the extracellular portions of TMH2 of Rho versus CB2 differ significantly, resulting in a shift in the location of residue 2.59, for example.
Binding Site of HU-243 at CB2 R*. K3.28 has been considered a primary interaction site for classic cannabinoids such as HU-243 at CB1 because a K3.28A mutation in CB1 leads to a significant reduction in the affinity of the classic cannabinoid HU-210 (Song and Bonner, 1996). However, CB2 mutation studies have suggested that K3.28 is not a primary interaction site for any class of CB agonist ligands at CB2 (Tao et al., 1999). We have hypothesized that EC-3 loop residue Asp275 forms a salt bridge with K3.28(109) in CB2, rendering K3.28(109) less available for ligand interaction. Rhee (2002) reported that in CB2, the IC50 of HU-243 increases from 1.2 ± 0.4 pM in WT to 15.3 ± 0.3 pM in an S7.39(285)A mutant. Therefore, S7.39(285) was used here as the primary interaction site for HU-243 in CB2. Our modeling studies revealed that K3.28(109) can indeed form a salt bridge interaction with Asp275 in the EC-3 loop (Asp275 O1 to K3.28 d = 2.54 Å, O- - H-N angle = 139°; Asp275 O2 to K3.28 d = 2.57 Å, O- - H-N angle = 143°). When the phenolic hydroxyl of HU-243 forms a hydrogen bond with S7.39(285) (d = 2.86 Å, O- - H-O angle = 151 °), the pyran oxygen of HU-243 can form a hydrogen bond (d = 2.81 Å, O- - H-O angle = 162°) with S2.60(90), a residue that becomes accessible from within the binding pocket in the TMH2 conformation calculated by conformational memories (see TMH2 Conformational Memories Results). S2.60(90) can also form a hydrogen bond with K3.28 (d = 2.73 Å, O- -H –N angle = 177 °). In this docking position for HU-243, the carbocyclic ring CH2OH group of HU-243 can also form a hydrogen bond with S6.58(268) (d = 2.74 Å, O-H - -O angle = 166 °) (Fig. 11). In the future, it will be illuminating to test these modeling predictions experimentally.

Left, the binding site of HU-243 in the CB2 R* state as predicted by modeling is illustrated here in a cut-away view of the TMH bundle from the viewpoint of TMH4 –5. In the energy minimized HU-243/CB2 R* complex, K3.28(109) forms two salt bridge interactions with Asp275 in the EC-3 loop. The phenolic hydroxyl of HU-243 forms a hydrogen bond with S7.39(285). The carbocyclic ring CH2OH group of HU-243 forms a hydrogen bond with S6.58(268). The pyran oxygen of HU-243 forms a hydrogen bond with S2.60(90), a residue that becomes accessible from within the binding pocket in the TMH2 conformation calculated by conformational memories. S2.60(90) also forms a hydrogen bond with K3.28(109). Right, an extracellular view of the HU-243/CB2 R* complex as predicted by modeling is illustrated here.
MTS Reagent Effects. Among the commonly used charged MTS reagents MTSEA+, MTSET+, and MTSES–, the potency in inhibiting [3H]HU-243 binding to the CB2 receptor was found here to be in the order MTSEA > MTSET ≫ MTSES. Javitch et al. (1999) reported that the presence of a negatively charged residue near a reactive Cys residue can attract the ammonium moiety of MTSEA and contribute to higher reactivity rates of this reagent compared with that of neutral or negatively charged reagents. The CB2 EC-3 loop (TTLSDQVKK) has an important sequence divergence from CB1 (GKMNKLIKT) in that there is a negatively charged residue (Asp275, underlined) in this loop only in CB2. We have hypothesized that Asp275 may serve as the counter-ion for K3.28(109) in the R* state of CB2, thus making K3.28 unavailable for ligand interaction in the CB2 activated state (Tao et al., 1999). In addition, as shown in Fig. 12, our simulations show that Asp275, which is near C2.59(89), can also attract MTSEA. This results in a different position for K3.28 in the TMH binding crevice. Once reacted with C2.59(89), MTSEA can form a salt bridge interaction with Asp275 (d = 2.58 Å, N-H - -O angle = 162°) and a hydrogen bond with N2.63(93) (d = 2.71 Å, N-H - - O = C angle = 168°). Asp275 also forms a hydrogen bond with S2.60(90) (d = 2.63 Å, O- -H-O angle = 167°) The MTSEA/Asp275 salt bridge is part of an interaction between K3.28(109), Asp275 and MTSEA. K3.28(109) forms a salt bridge with Asp275 (d = 2.56 Å, N-H - -O angle = 161°) and hydrogen bonds with S7.39(285) (d = 2.71 Å, N-H - -O angle = 168°) and with S2.60(90) (d = 2.66 Å, N-H - -O angle = 144°). It is clear in Fig. 12 that the result of MTSEA incorporation is that the new salt bridge structure (Asp275/MTSEA and Asp275/K3.28; see above) occupies much of the HU-243 binding site (Fig. 11) and thus can be expected to interfere with [3H]HU-243 binding at CB2.
The presence of negative charge (Asp275) in the EC-3 loop and the pattern of hydrogen bonding illustrated in Fig. 12 may explain why MTSEA has the highest reactivity at CB2 and also why reaction with the other positively charged MTS reagent, MTSET [CH2CH2N(CH3) +3] was slower. This reagent has a bulky trimethylamine group that is positively charged, but it cannot hydrogen-bond with Asp275. The negatively charged reagent MTSES would be repulsed by Asp275, which may explain why this reagent was unable to produce significant inhibition of [3H]HU-243 binding.
The inhibition of ligand binding was quite different between the neutral MTS reagents, such as MMTS (S-CH3) and MTSHE (S-CH2CH2OH) versus the positively charged MTSEA (-S-CH2CH2NH +3). Figure 12 shows that MTSEA can block the binding of [3H]HU-243 because it is attracted to Asp275 in the EC-3 loop of CB2 and thereby causes a rearrangement of the salt bridge that probably exists in WT CB2. Neither MMTS nor MTSHE has the ability to form salt bridges with Asp275 and therefore would not cause this rearrangement that sterically occludes the [3H]HU-243 binding site (compare Fig. 12 and Fig. 11).
Discussion
To validate the possibility that a cysteine is in the water-accessible binding crevice using the SCAM method, three criteria should be met (Javitch et al., 1994): 1) MTSEA added extracellularly irreversibly inhibits ligand binding, 2) binding activity is protected from MTSEA by pretreatment with ligands, and 3) mutation of cysteine to serine reduces sensitivity to the MTS reagent.

Left, the CB2 R* complex formed by MTSEA covalent attachment to C2.59(89) as determined by modeling is illustrated here. Left, the MTSEA modified CB2 R* bundle is shown here in a cut-away view of the TMH bundle from the viewpoint of TMH4 –5. In the energy-minimized, MTSEA-modified CB2 R* bundle, the head group of MTSEA (yellow) forms a salt bridge with Asp275 (pink) in the EC-3 loop and a hydrogen bond with N2.63(93) (cyan). K3.28(109) (pink) forms a salt bridge with Asp275 (pink) and hydrogen bonds with S7.39(285) (cyan) and S2.60(90) (cyan). Asp275 also forms a hydrogen bond with S2.60(90). Right, an extracellular view of the MTSEA-modified CB2 R* bundle is presented here. This view illustrates that covalent modification of C2.59(89) by MTSEA results in an altered salt bridge structure that occupies a significant portion of the ligand binding pocket in the TMH2–3-7 region.
In this study, the inhibition of CB2 receptor ligand binding by MTSEA and MTSET demonstrates that there is a cysteine(s) on the water-accessible surface of this receptor. The protection of the CB2 receptor by different cannabinoid ligands from reacting with MTSEA indicates that the cysteine(s) is in the binding crevice. The kinetics results for the mutants in Table 3 show that the WT CB2 reactivity is 1.14 ± 0.28 M–1s–1 and that only the C2.59S mutation had a statistically significant effect (a deleterious one) on the reactivity of CB2 with MTSEA. This result suggests that C2.59 is the residue that is primarily labeled by MTSEA in WT CB2. Furthermore, the magnitude of the rate of the reaction between MTSEA and C2.59 can give some indication of the location of C2.59 within the water-accessible binding crevice. In the dopamine D2 receptor, the rate of reaction of the endogenous C3.36(118), which faces directly into the binding site crevice, was approximately 40 M–1s–1. (Javitch et al., 1994). In contrast, for C6.47(285) in a β2-adrenergic receptor constitutively active mutant (CAM), the reaction rate was found to be 0.18 ± 0.02 M–1s–1(Javitch et al., 1997). They concluded that although C6.47(285) is much more reactive in the CAM than in WT β2R, C6.47(285) is not likely to be freely accessible in the binding site crevice; rather, it is likely to be intermittently accessible at the margin of the crevice.
In the work reported here, the rate of reaction of C2.59(89) with MTSEA (1.14 ± 0.28 M–1s–1) is between the values of the above two cysteines but closer to that of the C6.47(285) in CAM β2 receptor. Therefore, C2.59(89) in the CB2 receptor is probably not freely accessible in the binding crevice, but it is more likely to be accessible at the margin of the crevice. This, in turn, is consistent with modeling studies reported here that propose a model in which C2.59(89) is located in the TMH2–3 interface. The experimental result that C2.59(89) is accessible to MTSEA is striking because the corresponding residue in Rho [T2.59(92)] clearly faces out into lipid (Palczewski et al., 2000) (Fig. 10).
In the conformational analysis of TMH2 reported here, we tested the hypothesis that S2.54(84) in a g– (+60°) χ1 forms an intrahelical hydrogen bond that produces an alteration from normal α-helicity in CB2 TMH2 such that C2.59 becomes accessible to MTS reagent. This hypothesis was based upon the survey by Ballesteros et al. (2000) of the Brookhaven Protein Data Bank, which showed that serines inag– χ1 can induce bends in α helices. Although the survey by Ballesteros et al. (2000) assessed only helix bends, and we did not see a statistically significant difference in bend angles here, we did see a statistically significant difference in another measure of helix geometry (i.e., wobble angle). Therefore, results reported here support the more general hypothesis of the Ballesteros study (i.e., that serines in a g– χ1 can affect helix conformation).
The helix from the g– run chosen for bundle incorporation met the four criteria relating to the ability of each helix to be accommodated in the TMH bundle and to be connected to the EC-1 loop. It was chosen because it also made C2.59(89) more accessible from within the binding pocket. We found that in this helix, S2.54 hydrogen-bonded to the i-3 carbonyl induces a bend, as well as a change in wobble angle and face shift in CB2 TMH2, such that the number of residues per turn decreases (i.e., the helix is wound more tightly) above this residue. This difference leads to the very different placement of residue C2.59(89) (illustrated in Figs. 10 and 12, right), such that it is in the TMH2–3 interface and accessible to MTSEA.
Among the commonly used charged MTS reagents MTSEA+, MTSET+, and MTSES–, the potency in inhibiting [3H]HU-243 binding to CB2 receptor was in the order of MTSEA > MTSET ≫ MTSES. This order is similar to that of the D2 receptor (Javitch et al., 1994). The difference in potency of these three reagents in inhibiting ligand binding could be related to their difference in size and/or charge. With respect to size, the order would be MTSET (diameter, 0.58 nm) > MTSES > MTSEA (diameter, 0.36 nm). As for charge, the majority of MTSEA is positively charged at physiological pH, whereas MTSET and MTSES have positive and negative charges, respectively. Therefore, the major contributing factor for MTS reagents in inhibiting cannabinoid ligand binding must be the charge, because the negatively charged MTSES is smaller than the positively charged MTSET and bigger than the positively charged MTSEA, but MTSES had no effect on [3H]HU-243 binding to the CB2 receptor. In the D2 receptor, D3.32(114) is involved in ligand binding by interacting with positively charged dopamine. Positively charged MTSEA and MTSET may mimic positively charged D2 ligands so that they can easily react with cysteines within the binding crevice. Javitch et al. (1994) found that the native C3.36(118), which is one turn below D3.32(114), was responsible for MTSEA and MTSET inhibition, but MTSES had no significant effect on specific binding even at high concentration (100 mM had <15% inhibition). This effect can be attributed to charge repulsion between D3.32(114) and MTSES. Cannabinoid ligands are uncharged, yet charged MTS reagents still kept the same order of potency in inhibiting ligand binding in work reported here (MTSEA > MTSET ≫ MTSES). Our CB2 molecular modeling studies suggest that negatively charged Asp275 in EC-3 can attract MTSEA by forming a salt bridge with the head group of MTSEA. This interaction causes the rearrangement of the existing Asp275/K3.28(109) salt bridge, resulting in steric occlusion of much of the [3H]HU-243 binding site. On the other hand, the negatively charged MTSES would be repulsed by Asp275, which may be why this reagent was not able to produce significant inhibition of [3H]HU-243 binding.
To further test the characteristics of the ligand-binding pocket around C2.59(89), two neutral MTS reagents were used: MMTS (the smallest MTS reagent) and MTSHE (similar in size to MTSEA). MMTS and MTSHE had little effect on [3H]HU-243 binding to the CB2 receptor. It is possible that the MTS reagent did not react with the cysteine or that MTS reagents modified the cysteine, but the modification did not block ligand binding. To differentiate between these possibilities, high concentrations of MTSES, MMTS, or MTSHE were used first to preincubate with WT CB2, followed by MTSEA treatment. Pretreatment with MTSES did not affect the inhibitory effect of MTSEA, indicating that MTSES did not react with the C2.59(89) in the ligand binding crevice. In contrast, both MMTS and MTSHE pretreatment decreased the inhibitory effects of MTSEA. These data indicate that MMTS and MTSHE can react with C2.59(89), although these modifications had no direct effect on [3H]HU-243 binding. These results further suggest that there is a negative charge in the binding crevice or on the entrance to the binding crevice that repels the negatively charged MTSES but not the neutral MTS reagents. This negative charge is suggested by modeling to be Asp275 of the EC-3 loop. MMTS modifies the cysteine with a side chain -S-CH3 much smaller than that of the MTSEA. This could be one reason why the modification did not inhibit ligand binding. This is similar to the case of the D2 receptor (Javitch et al., 1994), in which linkage of -S-CH3 (from MMTS) to C3.36(118) did not block ligand binding. The side chains S-CH2CH2OH (from MTSHE), and -SCH2CH2NH +3 (from MTSEA) have similar sizes; however, the inhibition of ligand binding was quite different between the neutral MTSHE versus the positively charged MTSEA. These experimental data are consistent with the results of our molecular modeling studies, which suggest that MTSEA can block the binding of [3H]HU-243 because it is attracted and salt-bridged to Asp275 in the CB2 EC-3 loop, causing a rearrangement of the Asp275/K3.28(109) salt bridge that results in occlusion of the [3H]HU-243 binding site. Neither MMTS nor MTSHE has the ability to form salt bridges with Asp275 and therefore would not cause the rearrangement that blocks the binding of [3H]HU-243.
As shown in Fig. 6, ligand binding to the CB2C2.59S mutant receptor was inhibited by MTSEA treatment, albeit with reduced sensitivity compared with wild-type CB2. These data indicate that in addition to C2.59, one or more residual endogenous cysteines react with MTSEA to inhibit binding, although with lower reactivity. Thus the potential shielding of endogenous cysteines by other amino acid residues (as described in the modeling results section) must not be perfect and must not be able to completely protect these cysteines from reacting with MTSEA. As shown in Fig. 8, after MTSHE and MMTS pretreatments, 10 mM MTSEA could not inhibit specific binding, but 100 mM MTSEA treatment inhibited part of specific binding. The most likely explanation for these data are that after C2.59 is silently modified by MTSHE or MMTS, MTSEA can still react with other less reactive cysteine(s) to inhibit binding, albeit with less reactivity and therefore with a requirement for higher concentrations of MTSEA. These data again indicate that potential shielding of endogenous cysteines by other residues may reduce their reactivity with MTSEA but does not protect them completely.
Finally, although the modeling discussed above offers one explanation for the experimental observations reported here, it is possible that the accessibility of C2.59(89) parallels that found for W4.50(161) in the dopamine D2 receptor. In this case, Guo et al. (2003) have recently reported that the accessibility of W4.50(161) to MTSEA may be the result of its location in the D2 symmetrical dimer interface.
In conclusion, in this study, we found that ligand binding to the wild-type CB2 receptor is sensitive to MTSEA treatment and that this sensitivity is conferred mostly by C2.59(89). The accessibility of C2.59(89) to MTSEA provides experimental evidence for a conformational difference between TMH2 of CB2 versus Rho and modeling studies suggest that this deviation may be caused by the influence of S2.54(84) on the conformation of CB2 TMH2. To our knowledge, this is the first report to show a native cysteine C2.59(89) in the ligand binding crevice of the CB2 receptor. The C2.59(89)S mutant CB2 receptor can now serve as a MTS reagent-insensitive background for further study of the binding pocket of CB2 by the method of SCAM.
Footnotes
-
This work was supported in part by National Institutes of Health grants DA11551(to Z.H.S.), EY13632 (to Z.H.S.), DA03934 (to P.H.R.), and DA00489 (to P.H.R.).
-
Article, publication date, and citation information can be found at http://molpharm.aspetjournals.org.
-
doi:10.1124/mol.104.007823.
-
ABBREVIATIONS: GPCR, G protein-coupled receptor; CB, cannabinoid; SCAM, substituted cysteine accessibility method; TMH, transmembrane helix; MTS, methanethiosulfonate; WIN55212-2, (R)-(+)-[2,3-dihydro-5-methyl-3-(4-morpholinylmethyl) pyrrolo-[1,2,3-d,e]-1,4-benzoxazin-6-yl]-1-naphthalenyl-methanone; HU-210, Δ8-tetrahydrocannabinol dimethylheptyl; CP-55940, (1R,3R,4R)-3-[2-hydroxy-4-(1,1-dimethylheptyl)phenyl]-4-(3-hydroxypropyl)cyclohexan-1-ol; SR144528, N-[(1S)-endo-1,3,3-trimethyl-bicyclo-[2.2.1]-heptan-2-yl]-5-(4-chloro-3-methylphenyl)-1-(4-methylbenzyl)-pyrazole-3-carboxamide; HU-243, 11-hydroxyhexahydrocannabinol-3-dimethylheptyl; MTSEA, (2-aminoethyl)-methanethiosulfonate hydrobromide; MTSES, sodium (2-sulfonatoethyl)-methanethiosulfonate; MTSET, [2-(trimethylammonium)-ethyl] methanethiosulfonate bromide; MMTS, methyl methanethiosulfonate; MTSHE, 2-hydroxyethyl methanethiosulfonate; HEK, human embryonic kidney; TBS-T, Tris-buffered saline/Tween 20; Rho, rhodopsin; R, inactive; R*, active; GB/SA, generalized Born solvent-accessible surface area; PRCG, Polak-Ribier conjugate gradient; EC, extracellular loop; WT, wild-type; CAM, constitutively active mutant.
- Received September 30, 2004.
- Accepted April 19, 2005.
- The American Society for Pharmacology and Experimental Therapeutics


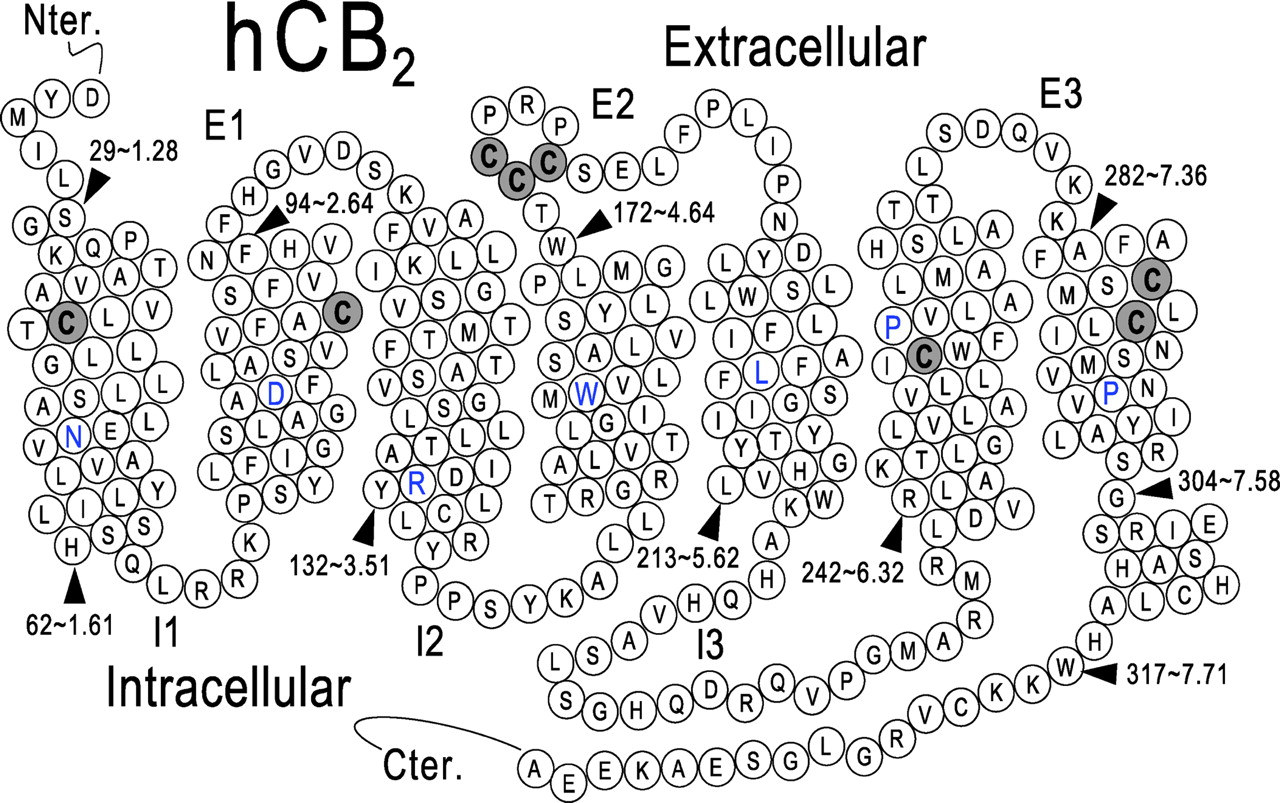
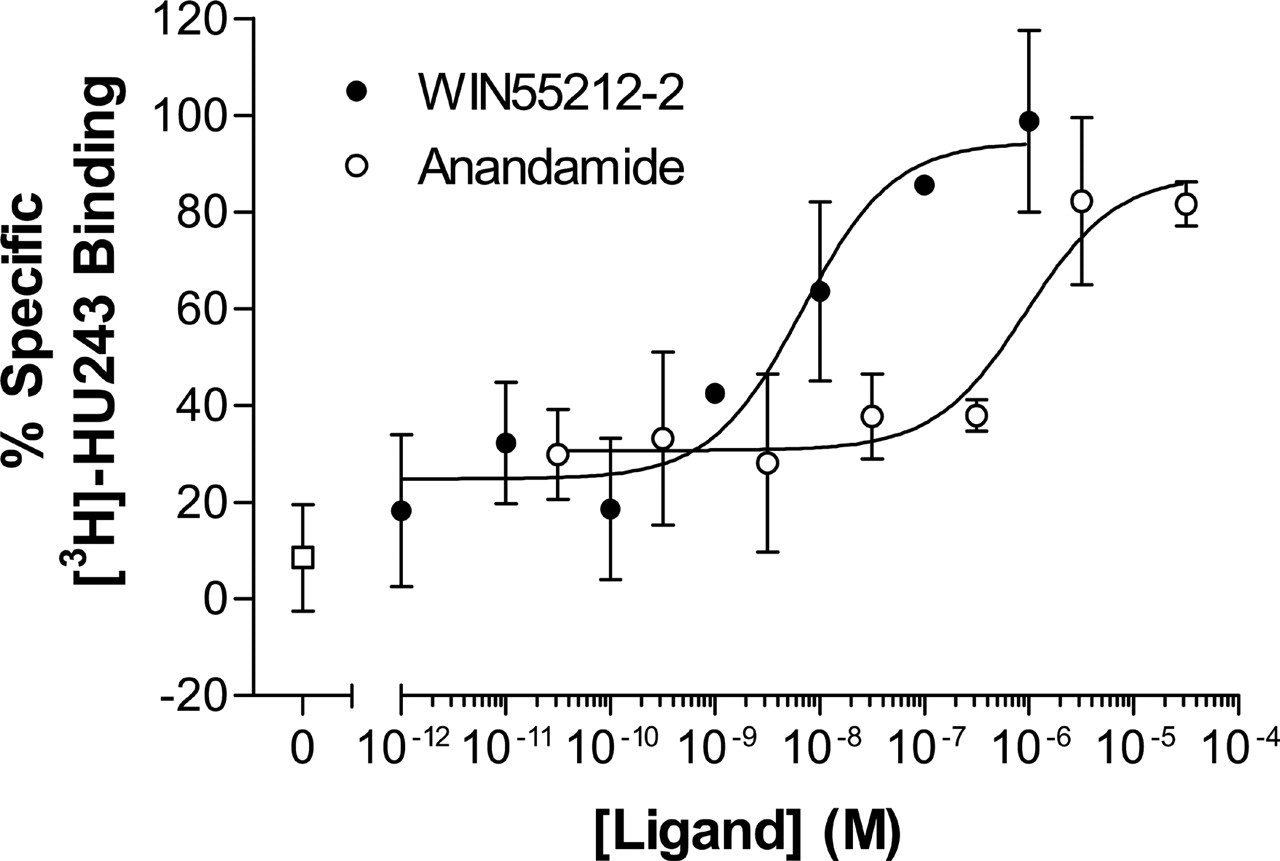
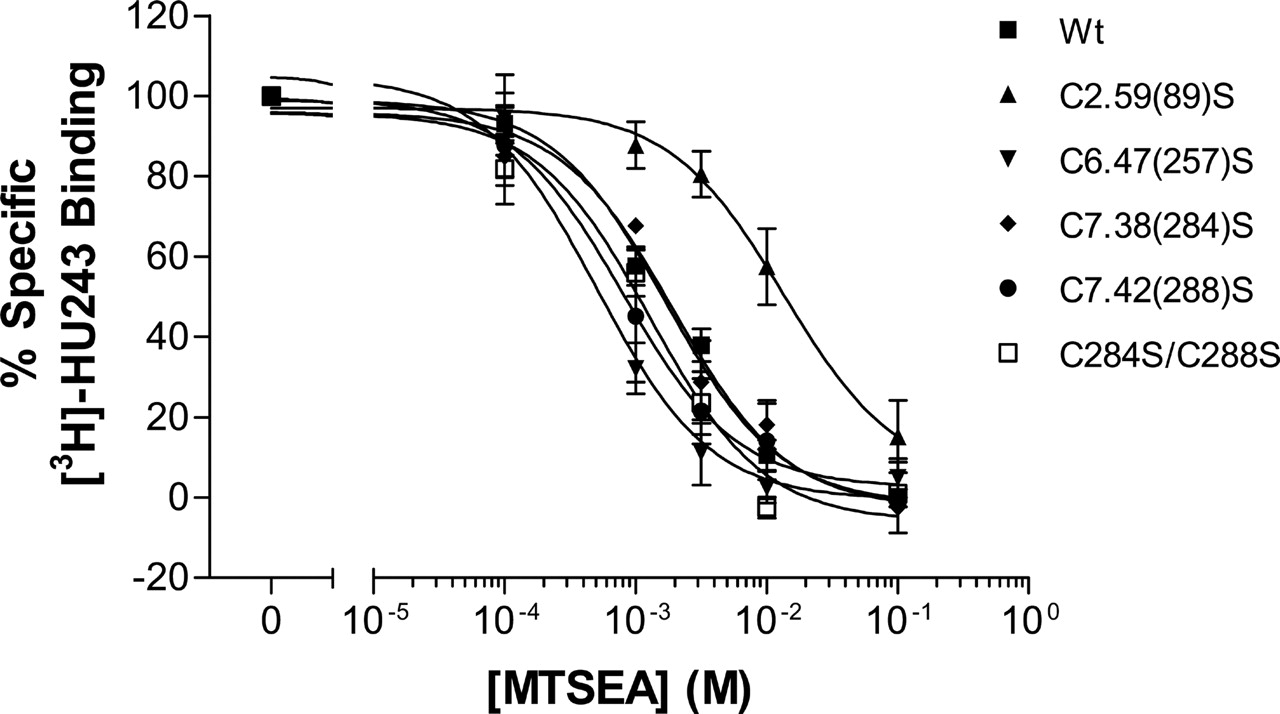
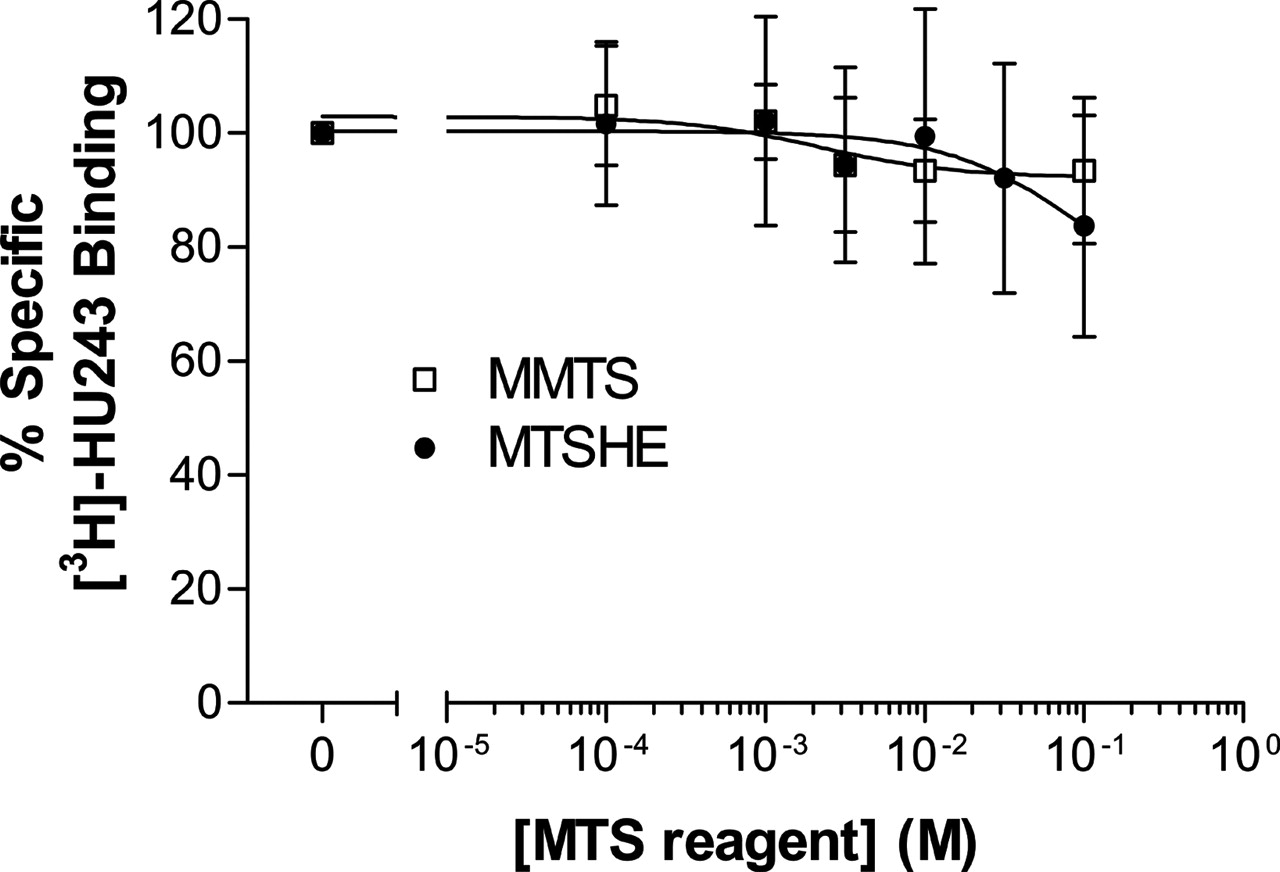
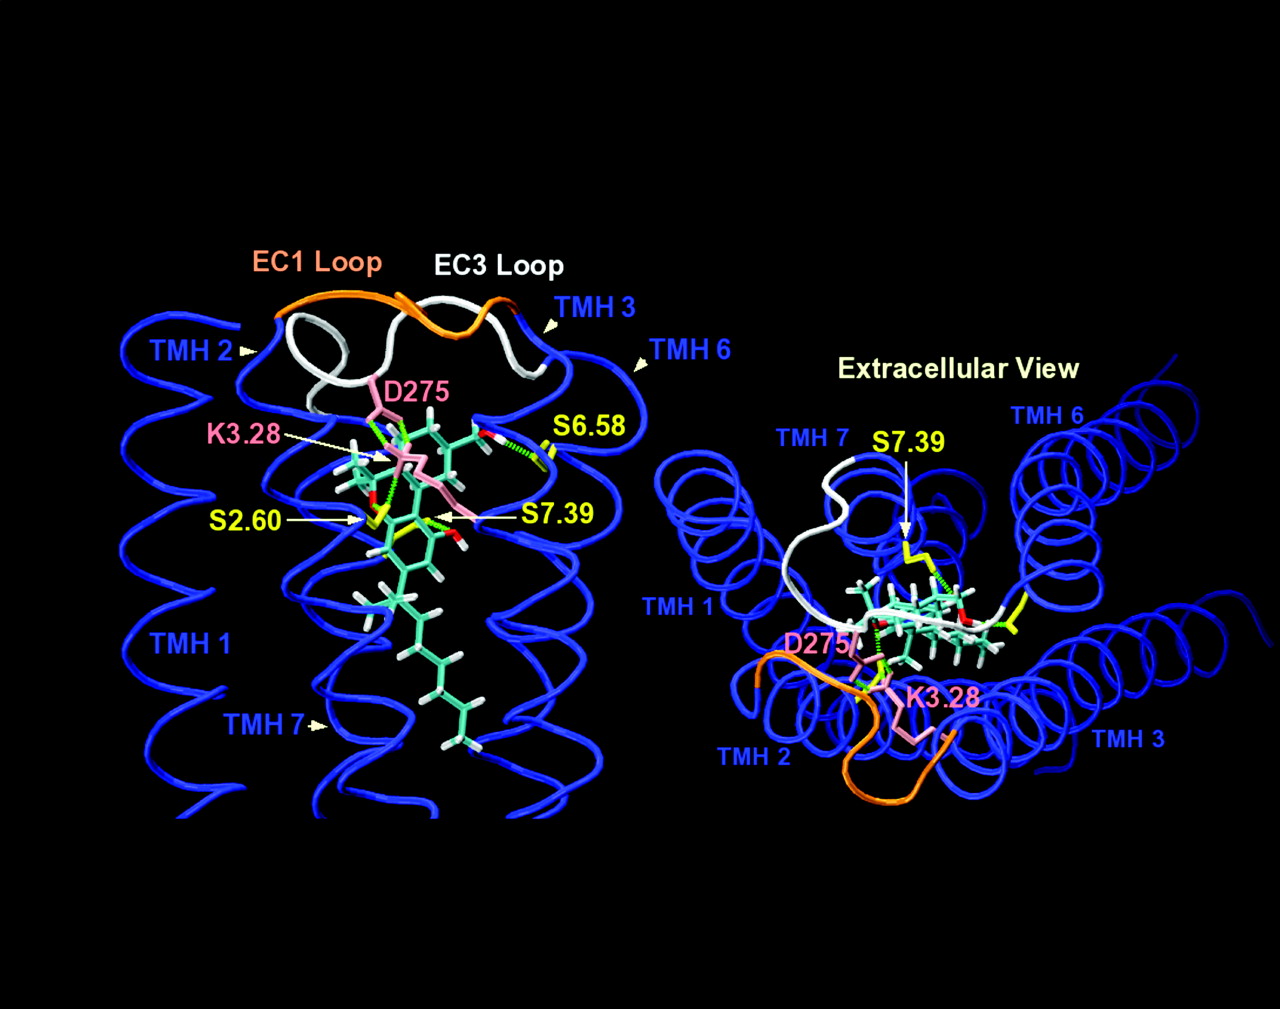