


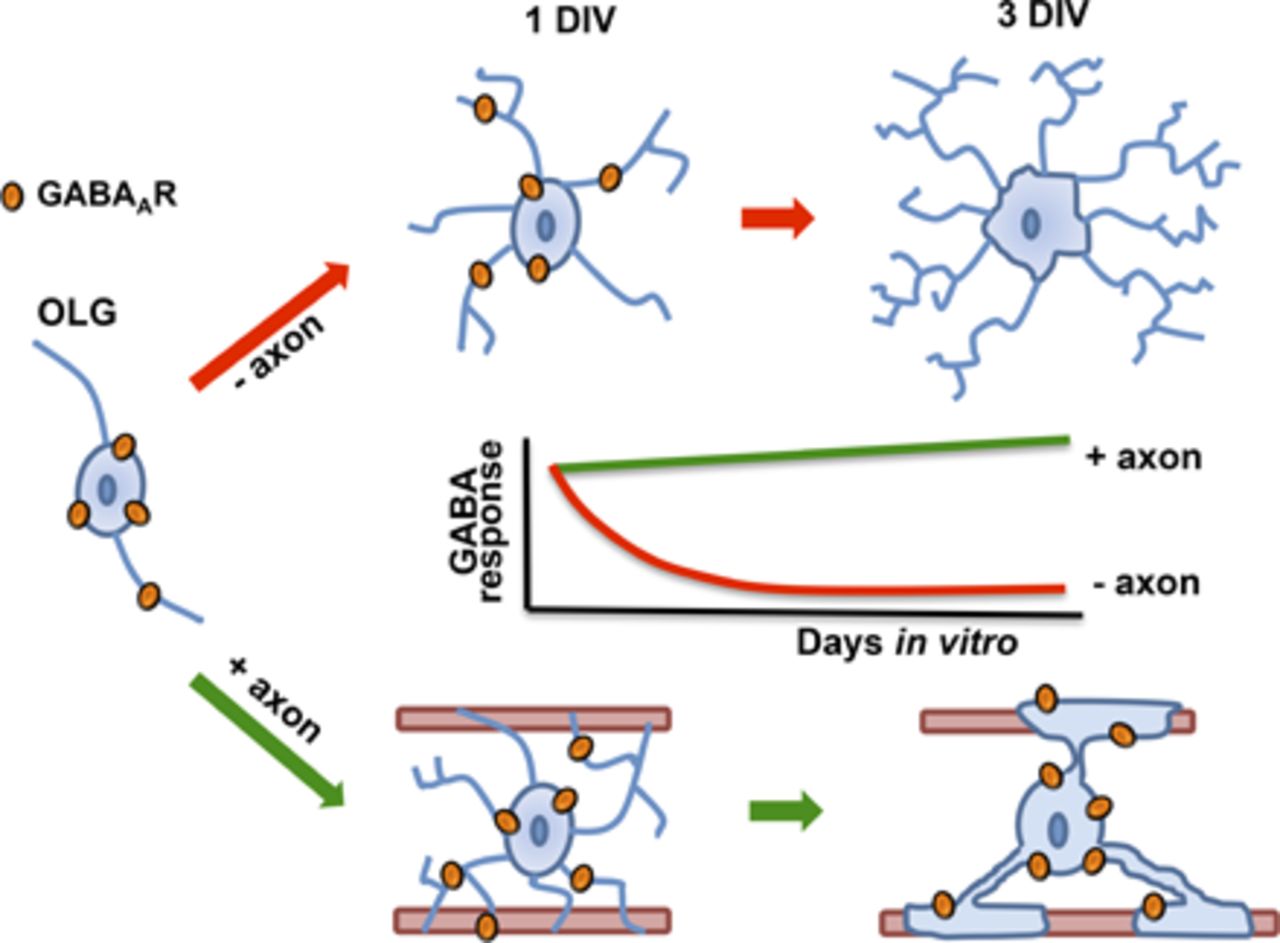
Visual Overview

Abstract
Myelination requires oligodendrocyte-neuron communication, and both neurotransmitters and contact interactions are essential for this process. Oligodendrocytes are endowed with neurotransmitter receptors whose expression levels and properties may change during myelination. However, only scant information is available about the extent and timing of these changes or how they are regulated by oligodendrocyte-neuron interactions. Here, we used electrophysiology to study the expression of ionotropic GABA, glutamate, and ATP receptors in oligodendrocytes derived from the optic nerve and forebrain cultured either alone or in the presence of dorsal root ganglion neurons. We observed that oligodendrocytes from both regions responded to these transmitters at 1 day in culture. After the first day in culture, however, GABA sensitivity diminished drastically to less than 10%, while that of glutamate and ATP remained constant. In contrast, the GABA response amplitude was sustained and remained stable in oligodendrocytes cocultured with dorsal root ganglion neurons. Immunochemistry and pharmacological properties of the responses indicated that they were mediated by distinctive GABAA receptors and that in coculture with neurons, the oligodendrocytes bearing the receptors were those in direct contact with axons. These results reveal that GABAA receptor regulation in oligodendrocytes is driven by axonal cues and that GABA signaling may play a role in myelination and/or during axon-glia recognition.
Introduction
Myelination of axons is critical for fast and efficient communication among distant neurons. It begins early after birth and proceeds throughout life, not only to maintain the functions of established circuits but also to generate or reinforce new connections formed during plastic phenomena, such as memory and learning (Zatorre et al., 2012). In addition, remyelination after demyelination promotes tissue repair and functional recovery in chronic and acute diseases that impair oligodendrocytes (OLGs) and myelin (Gallo and Armstrong, 2008; Franklin et al., 2012).
The myelinating program involves a series of cues that are transmitted between OLGs and neurons and that comprise multiple steps initiated at the early stages of oligodendrocyte precursor cell (OPC) differentiation. Among the signals that have been proposed as cues for differentiation and myelination are several neurotransmitters and growth factors. They probably act as paracrine or autocrine signals in addition to their role in synaptic transmission, and they have diverse effects in either stimulating or regulating specific membrane receptors expressed in the OPC and OLG membrane (Káradóttir and Attwell, 2007; Boulanger and Messier 2014). Thus, adenosine, glutamate, GABA, and ATP can modulate the proliferation, differentiation, and migration of OPC as well as OLG survival and myelination (e.g., Gallo et al., 1996; Gudz et al., 2006; Ishibashi et al., 2006; Domercq et al., 2010; Etxeberria et al., 2010; Wake et al., 2011; Zonouzi et al., 2015). In particular, both OPCs and mature OLGs express the two main subtypes of GABA receptors: GABAA (Hoppe and Kettenmann 1989; Von Blankenfeld et al., 1991; Berger et al., 1992; Cahoy et al., 2008) and GABAB (Luyt et al., 2007). Sensitivity to GABA in mature OLGs is greatly reduced (Berger et al., 1992), which suggests a specific role for GABA signaling in the development of the oligodendroglial lineage and during the initial stages of myelination and/or axon recognition (Vélez-Fort et al., 2012; Zonouzi et al., 2015). However, there is no detailed information about the status and fate of the different receptors and channels in this specific time window when OLGs encounter axons. Here, we have studied the sensitivity to GABA (and other neurotransmitters) of OLGs that were cocultured with dorsal root ganglion (DRG) neurons. We found that OLGs in contact with axons robustly express functional GABAA receptors, which are lost in OLGs cultured alone. The GABAA receptors expressed in OLGs showed unique characteristics that distinguished them from receptors present in neurons and astrocytes as well as OPCs in the adult brain.
Material and Methods
Rat Optic Nerve OLG Cultures.
Primary cultures of OLGs derived from optic nerves of 12-day-old Sprague-Dawley rats were obtained as described previously (Barres et al., 1992). Cells were seeded on 24-well plates bearing 12-mm-diameter coverslips coated with poly-D-lysine (10 µg/ml) at a density of 104 cells per well. Cells were maintained at 37°C and 5% CO2 in a chemically defined medium (Sato medium; Barres et al., 1992) consisting of Dulbecco’s modified Eagle’s medium supplemented with 100 μg/ml transferrin, 60 ng/ml progesterone, 40 ng/ml sodium selenite, 5 μg/ml insulin, 16 μg/ml putrescine, 100 μg/ml bovine serum albumin, triiodothyronine (30 ng/ml), and thyroxine (40 ng/ml). After 3–5 days in vitro (DIV), cultures were composed of at least 98% cells positive for O4 antigen and myelin basic protein (O4+/MBP+). The majority of the remaining cells were immunostained by antibodies against glial fibrillary acidic protein. No A2B5+ or microglial cells were detected in these cultures.
Rat Forebrain OLG Cultures.
Primary mixed glial cultures were prepared from newborn (P0–P2) Sprague-Dawley rats according to the modified technique of McCarthy and de Vellis (1980). Briefly, forebrains were removed from the skulls, and the cortices were isolated and digested by incubation (15 minutes, 37°C) in Hank’s balanced salt solution containing 0.25% trypsin and 0.4% DNAse. The cells were dissociated by passage through needles (21 G and 23 G), centrifuged, and resuspended in Iscove’s modified Dulbecco’s medium supplemented with 10% fetal bovine serum (Hyclone; Thermo Scientific, Waltham, MA) and antibiotic/antimycotic solution (Sigma-Aldrich, St. Louis, MO). Cells were seeded into poly-D-lysine–coated 75 cm2 flasks and maintained in culture at 37°C and 5% CO2. After 10–15 days in culture, the flasks were shaken (400 rpm, 2 hours, 37°C) to remove loosely adherent microglia. The remaining OPCs present on top of the confluent monolayer of astrocytes were dislodged by shaking overnight at 400 rpm. The cell suspension was then filtered through a 10-μm nylon mesh and preplated on bacterial grade Petri dishes for 2 hours. The nonadherent OPCs that remained in suspension were recovered and plated again on bacterial grade Petri dishes for 1 hour. The resulting enriched forebrain OPC cell suspension was centrifuged and resuspended in the Sato medium described above for OLG cultures. Cells were plated onto poly-D-lysine–coated 12-mm-diameter coverslips in 24-well culture dishes at a density of 104 cells/well, and the purity of oligodendroglial cultures was assessed by examining the characteristic cell morphologies under phase-contrast microscopy and confirmed by immunostaining with cell type–specific antibodies. After 1 day in culture, platelet-derived growth factor receptor α+ (PDGFRα+) OPCs represented 97 ± 5% of the total cells, and after 3 days in Sato medium, at least 98% were MBP+ cells.
Coculture of DRG Neurons with OLG.
DRGs were dissected from E15 rat embryos, dissociated with 0.25% trypsin and 0.4% DNAse at 37°C for 45 minutes, and mechanically triturated until a single-cell suspension was obtained. The dissociated cells were pelleted and resuspended in DRG medium composed of Neurobasal medium (Gibco; Thermo Scientific, Waltham, MA) supplemented with 10% fetal bovine serum (Gibco), 50 ng/ml nerve growth factor (Invitrogen, Carlsbad, CA), and 2% B27 supplement (Invitrogen). The cells were plated onto poly-D-lysine–coated Petri dishes for 30 minutes to remove most of the fibroblasts and Schwann cells, which attach to the surface of the dish. The supernatant with neurons was removed and centrifuged, and the cells were plated onto poly-D-lysine–laminin coated coverslips at a density of 5 × 10⁴ cells per coverslip (50-μl drops). The cells were left in the incubator overnight, after which they were covered with 450 μl of DRG medium. To remove contaminating fibroblasts and glial cells, the cultures were pulsed twice with 10 μM cytosine arabinoside for 2 days each time. Following the last round of purification, the DRG neurons were cultured for at least 2 weeks in DRG medium alone, with fresh medium added every 3 days.
For DRG cocultures, isolated OLGs (either from the optic nerve or forebrain) were plated on a 2- to 3-week-old DRG neuron culture at a density of 2 × 10⁴ cells/coverslip. The medium was changed to a 50:50 mixture of Sato and DRG medium, without nerve growth factor, and the cultures were left for different times in this medium to allow the oligodendroglial cells to associate with the DRG axons before the experiments were done.
Immunocytochemistry.
To characterize isolated OLGs or OLGs cocultured with DRG neurons, the cells were immunostained with antibodies against oligodendroglial or neuronal cell-specific markers: mouse anti-O4 (10 μg/ml, Ref. MAB345; Chemicon International, Temecula, CA); rabbit anti-PDGFRα (1:200, Ref. 338; Santa Cruz Biotechnology, Santa Cruz, CA); mouse anti-MBP to visualize myelin formation (1:100, Ref. SMI-99; Covance, Princeton, NJ); and rabbit antineurofilament to visualize neurites (1:200, Ref. 2837; Cell Signaling Technology, Danvers, MA). In all cases except for the O4 antigen, the cells were fixed in 4% paraformaldehyde in phosphate-buffered saline (PBS) for 20 minutes at room temperature. The fixed cultures were permeabilized with 0.1% Tween 20, blocked with 5% goat serum in PBS for 30 minutes, and incubated overnight at 4°C, with the antibodies diluted in PBS containing 5% goat serum and 0.1% Tween 20. Then, the cells were rinsed and incubated for 2 hours at room temperature with 1:200 anti-mouse or anti-rabbit IgGs conjugated with Alexa 488 or Alexa 594 (Molecular Probes, Eugene, OR). Coverslips were mounted on glass slides with fluorescent mounting medium (Glycergel; Dako, Glostrup, Denmark), and the preparations were visualized under a laser scanning confocal microscope (TCS SP8X; Leica Microsystems Inc., Buffalo Grove, IL) with a 40× objective.
For immunostaining of the O4 antigen, live cells were incubated for 30 minutes at 37°C with mouse anti-O4 monoclonal antibodies diluted in Sato medium. After being rinsed with PBS, the cells were fixed with 4% paraformaldehyde before incubating for 2 hours with secondary Alexa-594 anti-mouse IgM (1:200; Molecular Probes) in PBS containing 5% goat serum. Then, the coverslips were washed, mounted on slides, and evaluated under a confocal microscope.
For immunostaining of surface GABAA receptor subunits, live cells were incubated with anti-GABAA antibodies (1:100; Alomone, Jerusalem, Israel) in culture medium at 37°C for 5 minutes. Double labeling with antibodies to specific subunits and oligodendrocyte markers was done as described above for single staining by adding both primary antibodies together. The absence of nonspecific interactions of secondary antibodies was verified by omitting the primary antibodies.
Electron Microscopy.
Ultrastructural localization of GABAA receptors was carried out using pre-embedding immunohistochemistry. Adult (10 weeks) Sprague-Dawley rats were deeply anesthetized and transcardially perfused with 4% paraformaldehyde and 0.1% glutaraldehyde in 0.1 M PBS (pH 7.4) and postfixed in the same solution for 2 hours. Vibratome sections (50 μm) of the rat brain were preincubated in 10% goat serum in PBS (blocking solution) for 1 hour. Sections were then incubated with rabbit anti-GABAA antibodies (1:250; Alomone) in blocking solution for 2 days at 4°C with continuous shaking. After several washes in PBS, tissue sections were incubated with biotinylated horse anti-rabbit (1:200) and processed for immunoperoxidase staining as indicated by the supplier (Vector; Palex Biomedical, Barcelona, Spain). Subsequently, sections were incubated in 1% osmium tetroxide for 30 minutes, dehydrated, and embedded in Epon Resin 812 (Electron Microscopy Sciences, Hatfield, PA). Ultrathin sections were counterstained with lead citrate and examined using a Philips EM208S (Philips Innovation Services, Eindhoven, The Netherlands) electron microscope at the Analytic Microscopy Service of the University of the Basque Country. Photographs were taken using a digital camera coupled to the electron microscope, and minor adjustments in contrast and brightness of the images were made using Adobe Photoshop (Adobe Systems, Mountain View, CA).
Electrophysiology.
Whole-cell recordings were performed at room temperature using the Axon 700B amplifier (Axon Instruments, Molecular Devices, Sunnyvale, CA). Currents were recorded at a holding membrane potential of −80 mV (unless otherwise stated), digitized, and stored for analysis using the A/D Converter Digidata1400 (Axon Instruments) and pClamp10 software (Axon Instruments). In most cases, peak currents generated at −80 mV by drug superfusion were used for the analysis. Current-voltage (I/V) relationships were built by changing the membrane potential from −140 to +40 mV in 20-mV steps (250 milliseconds), the peak membrane current values at the beginning for each step were plotted. In some instances, cells were held at a desired membrane potential while GABA was superfused, and the peak currents generated were I/V plotted. The extracellular bath solution with a pH of 7.3 contained the following (in mM): 140 NaCl, 5.4 KCl, 2 CaCl2, 1 MgCl2, and 10 HEPES (Attali et al., 1997). Patch-clamp pipettes (3–5 MΩ) were filled with an internal solution at pH 7.3 containing the following (in mM): 140 KCl, 2 CaCl2, 2 MgCl2, 10 HEPES, 11 EGTA, 2 Na-ATP, and 0.2 GTP. The high K+ (HK+) external solution was prepared by replacing 20 mM NaCl with KCl in the external solution. Perforated whole-cell recording was performed using 5 µg/ml gramicidin added to the internal solution from a fresh stock solution of gramicidin prepared in dimethylsulfoxide. Agonists and other drugs were added to the external solution from stock solutions. When necessary [e.g., diazepam (DZP; [7-chloro-1-methyl-5-phenyl-3H-1,4-benzodiazepin-2(1H)-one]) and loreclezole ((Z)-1-[2-chloro-2-(2,4-dichlorophenyl)ethenyl]-1H-1,2,4-triazole)], dimethylsulfoxide was no more than 0.1% in the final solution. In some experiments, cells under patch-clamp recording were loaded with Lucifer yellow (2 mM) added to the internal solution for subsequent visualization using confocal microscopy. OLGs in coculture were chosen for an electrical recording based on their close apposition to axons in areas that were otherwise free of other cells. The OLG electrophysiological profile was confirmed subsequently.
Fluorometry.
Intracellular Ca2+ concentration ([Ca2+]i) change was determined according to the method described previously (Grynkiewikcz et al., 1985). OLGs were loaded with Fluo4-AM (5 µM; Invitrogen) in culture medium for 30 minutes at 37°C. Cells were washed in Hank’s balanced salt solution containing 20 mM HEPES, pH 7.4, 10 mM glucose, and 2 mM CaCl2 (incubation buffer) for 5 minutes at room temperature. Experiments were performed in a coverslip chamber continuously perfused with incubation buffer at 1 ml/min. The perfusion chamber was mounted on the stage of a Zeiss (Oberkochen, Germany) inverted epifluorescence microscope (Axiovert 35) equipped with a 150 W xenon lamp Polychrome IV (T.I.L.L. Photonics, Martinsried, Germany) and a Plan Neofluar 40× oil immersion objective (Zeiss). Cells were visualized with a high-resolution digital black/white charge-coupled device camera (ORCA; Hamamatsu Photonics Iberica, Barcelona, Spain), and image acquisition and data analysis were performed using the AquaCosmos software program (Hamamatsu Photonics Iberica). Data were analyzed with Excel (Microsoft, Seattle, WA) and Prism (GraphPad Software, San Diego, CA) software.
Substances.
Diazepam, 5-(2-fluorophenyl)-1,3-dihydro-1-methyl-7-nitro-2H-1,4-benzodiazepin-2-one; 4,5,6,7-tetrahydroisoxazolo(5,4-c)pyridin-3-ol hydrochloride (THIP), loreclezole,4-ethyl-6,7-dimethoxy-9H-pyrido(3,4-b)indole-3-carboxylic acid methyl ester (DMCM), butyl β-carboline-3-carboxylate (β-CCB), and N-methyl-N-(3-[3-(2-thienylcarbonyl)pyrazolo(1,5-a)pyrimidin-7-yl]phenyl)acetamide (indiplon), were all from Tocris Bioscience (Bristol, UK). All salts as well as cytosine arabinoside, GABA, glutamate, ATP, adenosine, tetrodotoxin, verapamil, bicuculline, gramicidin, and picrotoxin were from Sigma-Aldrich.
Statistical Analysis.
Data are presented as the mean ± S.E.M. The significance of differences between two datasets was tested with the unpaired Student’s t test. For multiple comparisons, we used analysis of variance (ANOVA) (Tukey’s post hoc). In all instances, values with P < 0.05 were considered significant.
Results
Responses to GABA Decrease Dramatically with Time in Isolated OLGs In Vitro.
Both optic nerve and forebrain OLGs were monitored electrophysiologically using the patch-clamp technique in cultured cells. Responses elicited by the application of the neurotransmitters glutamate (Glut), ATP, adenosine, and GABA (all at 1 mM) were studied from 1 to 3 DIV in cells held at −80 mV (Fig. 1, A and B). In addition, the responses to HK+ solution were also monitored as an index for potassium current generation through inwardly rectifying K+ channels (Fig. 1) since they were fully blocked by extracellular 100 µM Ba2+ (data not shown). As reported earlier, at 1 DIV, OLGs responded to GABA-, Glut-, or ATP-generating inward currents (Berger et al., 1992; Matute et al., 2007). Applying adenosine instead did not elicit any electrical response (16 and 13 OLGs from the optic nerve and forebrain, respectively). The HK+ solution elicited stronger inward currents at 1 DIV in optic nerve OLGs (476 ± 123 pA; n = 23) than in OLGs derived from the forebrain (38 ± 25 pA; n = 17) (Fig. 1C), a result that is consistent with previous studies (Sontheimer et al., 1989; Attali et al., 1997). Responses generated by GABA, Glut, or ATP were associated with an increase in membrane conductance, and their kinetic characteristics suggested the activation of their respective receptor channels. With time in culture, OLGs from the optic nerve showed a gradual and strong decrease in their sensitivity to GABA, from 868.8 ± 76 pA at 1 DIV to 26.7 ± 11 pA at 3 DIV (n = 22 each). However, the responses to Glut and ATP roughly maintained both their amplitude and general characteristics (40 ± 12 pA and 15 ± 3 pA, respectively) while remaining electrically unresponsive to adenosine (Fig. 1, A and B). Similarly, forebrain OLG responses to GABA decreased (from 438 ± 87 to 16 ± 4 pA; n = 16 in each case) after 2 to 3 DIV, whereas Glut responses were unchanged, and currents generated by HK+ increased gradually with time (Fig. 1C). Thus, OLGs from the optic nerve and forebrain cultured alone lost their sensitivity to GABA between 2 and 3 DIV and did not recover it during the time monitored (up to 5 DIV).

Inward current responses elicited by neurotransmitters and HK+ solution of isolated OLGs in culture. (A) Current responses elicited by GABA, Glut, ATP, and adenosine (ADE) (all at 1 mM) as well as HK+ solution in optic nerve OLGs maintained alone for 1 DIV (top row). In this and subsequent records, drugs or HK+ were applied during the times indicated by bars at the top, and cells were held at −80 mV. A similar protocol of response activation monitored in OLGs maintained for 3 DIV is illustrated in the bottom row. (B) Average (mean ± S.E.M.) amplitude current response elicited by agonists (1 mM) and HK+ solution superfusion of OLGs (23–39 OLGs for each case) maintained alone for 1–3 DIV. (C) Inward current responses elicited in forebrain OLGs cultured alone in differentiation medium monitored at 1 DIV (top row) or 3 DIV (bottom row). Agonist concentrations were as in (A).
GABA Responses Are Maintained in OLGs Cocultured with DRG Neurons.
OLGs grown in isolation may lack axonal signals needed to sustain GABA signaling. To test this possibility, we cocultured OLGs together with DRG neurons. Under these conditions, both cell types showed similar Glut and ATP responses that were stable with time in culture (data not shown) and had an amplitude and kinetics similar to those observed in freshly isolated OLGs, regardless of their origin. OLGs retained GABA sensitivity in the presence of neurons (Fig. 2A). Indeed, the amplitude of the responses to GABA tended to increase with time in culture. Thus, in four different cell preparations of optic nerve OLG-neuron cocultures, at 1 DIV, GABA responses had an average amplitude of 1135 ± 156 nA (n = 25), whereas at 3 DIV, it was 2824 ± 303 nA (n = 41). Similarly, forebrain OLGs cocultured with DRG neurons remained sensitive to GABA over time, and responses at 1 and 3 DIV had an average amplitude of 583 ± 95 pA (n = 14) and 1998 ± 227 pA (n = 53), respectively (Fig. 2A). This effect was maintained when current responses were normalized for cell capacitance (Fig. 2B). Notably, cocultured optic nerve or forebrain OLGs continued to have robust GABA responses at 16 DIV (2340 ± 560 pA; n = 8) or 11 DIV (1736 ± 349 pA; n = 13), respectively.

Inward current responses in OLGs cocultured with DRG neurons. (A) Membrane current responses elicited by 1 mM GABA or HK+ solution in optic nerve and forebrain OLGs that were cocultured together with DRG neurons. Recordings were made on the third day in vitro. (B) Columns correspond to the average current in response to GABA (1 mM) for cells 1–3 DIV, normalized against the membrane capacitance in each condition: OLG cultured alone (− DRG neurons), cocultured with DRG neurons (+ DRG neurons), OLGs cultured 3 DIV in control nonconditioned medium (CtM), or OLGs cultured for 3 days in medium conditioned by DRG neurons for 7 days (CoM).
To explore the possibility that soluble factors released by neurons sustained the expression and function of GABA receptors in OLG-neuron cocultures, we used a medium that had been conditioned by DRG neurons for 7 days to culture OLGs and found their GABA responses were similarly downregulated (Fig. 2B). Moreover, OLGs (n = 11) cocultured at 3 DIV with neurons in the presence of 1 µM tetrodotoxin generated responses to 1 mM GABA as robust as those in control cultures (1856 ± 347 versus 2049 ± 287 pA, corresponding to 72 ± 13 versus 78 ± 11 pA/pF, respectively), which suggests that the expression of receptors in OLGs was independent of basal axonal electrical activity.
Myelin Protein Expression and I/V Relationship in OLGs Cocultured with DRG Neurons.
Previous studies showed that OLGs engage in the myelination of axons when cocultured with DRG neurons (e.g., Chan et al., 2004; Wake et al., 2011). To assess this feature in the cocultures used, we analyzed the expression of MBP as an index of maturation and evaluated the impact of myelination on the I/V relationship in OLGs in the critical period for GABA receptor expression (1 and 3 DIV).
At 1 DIV the vast majority of cells (>95%) in the cultures derived from the optic nerve were O4+, a marker for premyelinating OLGs, whereas the antibody against PDGFRα labeled >95% of cells in OLG cultures derived from the forebrain (Fig. 3A), indicating that at this stage (1 DIV), these cultures contained mostly OPCs. Both OLG cultures presented a robust expression of MBP at 3 DIV and thereafter, either when cultured alone or together with neurons (Fig. 3A). In the latter cultures, MBP+ processes were frequently seen in contact with axons, as visualized by neurofilament labeling.

Expression of markers and I/V relation profile of OLGs cocultured with DRG neurons. (A) Images illustrate the expression of markers in optic nerve and forebrain OLGs cultured alone or cocultured with DRG neurons. The vast majority of isolated cells were O4+ (optic nerve OLGs) or PDGFRα+ (forebrain OLGs) after 1 DIV (in red, first column). In both cell types cultured alone, MBP (in red) was strongly expressed starting at 2 to 3 DIV (second column). In cocultures with DRG neurons (third and fourth columns), expression of MBP (in green) in OLGs was also observed at 2 to 3 DIV. Colabeling of axons [neurofilaments (NF-L) in red] and MBP (green) suggested a close interaction based on the extensive overlay of the myelinating protein signal with NF-L+ axons. Bar = 30 µm. (B) Graphs illustrate the I/V relationships of optic nerve OLGs cocultured with DRG neurons recorded during the first (⬤) and third (○) DIV. Traces are examples for each case of the voltage-step protocol applied from −140 to +40 mV in cells held at −80 mV. Data points are the average peak current (± S.E.M.) recorded in 9–12 cells in each condition. (C) I/V relationships obtained in the same conditions as in (B) for forebrain OLGs cocultured with DRG neurons.
It is known that K+ currents in OLGs change during maturation. Thus, OPCs present a nonlinear I/V relationship due to the expression of voltage-dependent K+ channels and few or no inwardly rectifying K+ channels (Sontheimer et al., 1989; Berger et al., 1991; Attali et al., 1997). To assess this property, OLGs were cocultured with DRG neurons and monitored electrically by applying voltage steps from −140 to +40 mV. The resulting I/V relationships were built as illustrated in Fig. 3. Most optic nerve OLGs at 1 DIV showed a near-linear I/V relationship (Fig. 3B), whereas forebrain OLGs (Fig. 3C) displayed a strong rectification with low conductance for inward currents. Then, gradually, with longer times in coculture (at 3 DIV) with neurons, the inward currents increased in both OLG preparations and their I/V relationships became more linear. This change correlated directly with the current increase elicited by HK+ superfusion between 1 and 3 DIV (117 ± 65% and 298 ± 81% for optic nerve and forebrain OLGs, respectively; n = 31 in each case). In addition, forebrain OLG cultures, which at 1 DIV typically presented voltage-dependent outward currents with inactivating kinetics characteristic of voltage-dependent K+ channels (Attali et al., 1997), progressively lost the inactivating phase at 3 DIV (Fig. 3C). Together, these results indicate that as OLGs mature, their myelinating and electrical properties become similar regardless of their regional origin.
GABA Responses Elicited in OLGs in Close Contact with Axons Versus OLGs without Contact.
In cocultures with neurons, many OLGs establish close contacts with axons, whereas others do not (Fig. 3). We wondered whether these two populations of cells were similarly sensitive to GABA. To that end, we recorded the maximal response to GABA (1 mM) in cells contacting axons or not during the interval of 3–11 DIV. Interestingly, cells in contact with axons had a strong response to GABA (n = 54 and n = 42 for optic nerve and forebrain OLGs, respectively), which was absent in cells growing without direct apposition to the axons (n = 23 and n = 18 for optic nerve and forebrain OLGs, respectively; Fig. 4A). These results clearly indicate that a direct neuron-glia interaction is required to maintain the sensitivity to GABA.

GABA responses in OLGs with or without contact with axons. (A) Current response to 1 mM GABA was monitored in OLGs either in contact (+axon) or not (−axons) with axons. Conditions correspond to cells grown on the same coverslips. Each data point represents the response in a cell recorded between 3 and 11 DIV. The average current response and S.E.M. are also shown for each group. Amplitude differences in the –axon group were significantly different from those in the +axon group (P < 0.05). (B) Images illustrate OLGs in contact with axons or without axonal contact. The OLGs were loaded with Lucifer yellow during a whole-cell electrical recording. Bar = 20 µm. (C) Current responses displayed by cells shown in (B). The I/V relationship corresponds to voltage steps from −200 to +20 mV in cells held at −80 mV.
To characterize the morphology of GABA responding and nonresponding cells, a group of OLGs was loaded with Lucifer yellow during recording (Fig. 4B). We observed that OLGs in contact with axonal bundles typically developed parallel processes in contact with several individual axons, whereas OLGs without axon contacts had a generally more radial appearance. However, both subpopulations of cells showed robust responses to HK+ solution and similar linear I/V relationships (Fig. 4C).
Properties of GABA Receptors in OLGs Cocultured with Neurons.
Responses elicited by GABA in OLGs cocultured with neurons were studied in more detail to characterize and compare them with those reported previously in various different experimental conditions. GABA responses in OLGs (3–5 DIV) were dose dependent and had an EC50 of 79 ± 12 µM (Fig. 5A). The current response inverted at +3 ± 2 mV (n = 13) using the standard whole-cell patch-clamp configuration (Fig. 5B). However, using the gramicidin-perforated whole-cell configuration, the inversion potential was at −24 ± 3.5 mV (n = 8) (Fig. 5B). This suggests that GABA generated cell depolarization, which was confirmed by monitoring the membrane potential in gramicidin-perforated cells. These cells showed an average membrane potential of −74 ± 8 mV, which depolarized to −32 ± 6 mV (n = 13) in the presence of 100 µM GABA (Fig. 5C).

Dose-response (D-R) curve in response to GABA and I/V relationship in cultured OLGs. (A) The GABA response was elicited by applying the distinct concentrations of the agonist as illustrated, and the current recorded was normalized against the current obtained at 1 mM for each cell. The data points represent the average normalized current response. Recordings were done in optic nerve OLGs cultured alone during the first day in vitro as well as in OLGs cocultured with DRG neurons in the interval from 1 to 8 DIV (n = 8). No difference in the potency of GABA was observed either between the later OLG groups or when the D-R curves were built in similar experiments recording forebrain OLGs. D-R curve adjustment parameters were EC50 = 79 ± 12 µM and H = 1.1. (B) I/V curves were built for the GABA responses holding the OLG membrane at distinct potentials as illustrated in each trace. Currents were monitored using the standard whole-cell recording (n = 13) or by “perforated” voltage-clamp using gramicidin (n = 8), and the average peak current was plotted for each potential. Note that in perforated patch-clamp conditions, the GABA response inverted around −24 mV. (C) In perforated patch-clamp recording, GABA elicited depolarization of the resting membrane potential (black trace) in OLGs. The current response in the same cell is also shown (gray trace) and was drawn inverted to compare the time courses. (D) The GABA response in OLGs was mimicked by muscimol (gray traces), which was more potent than GABA (black trace). (E) Bicuculline strongly antagonized generation of the GABA response. Two different concentrations of the antagonist are illustrated (gray traces; GABA control response in black). (F) Picrotoxin (gray trace) blocked the generation of GABA responses (in black). (G) The GABAA receptor agonist THIP (300 µM, gray trace) did not mimic the GABA (300 µM) current response.
GABA (100 µM) responses were mimicked by muscimol but with greater potency. They were fully antagonized by bicuculline, with an IC50 close to 1 µM (n = 9 and n = 6 for the optic nerve and forebrain OLG, respectively, for both drugs) and blocked by 100 µM picrotoxin (n = 6 OLGs) (Fig. 5, D–F). We also tested the effect of THIP (100–300 µM), a GABA analog and potent agonist of GABAA receptors containing the δ subunit (Meera et al., 2011), and observed that 300 µM THIP elicited weak responses of 48 ± 17 pA (n = 23), which were 2.4 ± 0.36% of those elicited by GABA (300 µM) (Fig. 5G). Thus, GABA receptors in OLGs cocultured with neurons corresponded to the GABAA subtype, which was similar to those described in freshly isolated OLGs (Von Blankenfeld et al., 1991; see also, Bronstein et al., 1998), OPCs (Williamson et al., 1998), and OLGs from both optic nerve and corpus callosum slices (Berger et al., 1992) as well as in those expressed in NG2+ cells from an adult brain (Lin and Bergles 2004).
Next, we carried out an in-depth characterization of the pharmacology of the GABAA receptors expressed in OLGs cocultured with neurons (Fig. 6). GABAA currents (30 µM GABA) were not sensitive to 10 µM indiplon (n = 25), a pyrazolopyrimidine and a positive allosteric modulator that acts at the benzodiazepine-binding site (Petroski et al., 2006), suggesting that the GABAA receptor in OLGs did not contain the γ2 subunit. Control experiments performed with DRG neurons showed that 10 µM indiplon potentiated their GABA (10 µM) response by 187.8 ± 19% (n = 7).

Pharmacology of GABAA receptors expressed in OLGs in coculture with DRG neurons. (A) Traces illustrate the effect provoked by distinct drugs coapplied with 30 µM GABA (around the EC30 of the response). Each set of traces included the control response elicited by GABA alone or in coapplication with a drug (10 µM) and the recovery of the GABA response after washing. The interval between applications was 80–100 seconds of continuous external solution superfusion. (B) The graph shows the effect of the drugs illustrated in (A) on the GABA response, and the effects elicited by FZP and THIP (as in Fig. 5G). All the effects were normalized against the corresponding response to 30 µM GABA alone (13–19 OLGs for each drug), with the exception of 300 µM THIP (n = 6), which was normalized against the current obtained by 300 µM GABA in the same cells. All groups, with the exception of indiplon, were significantly different from the GABA control response (P < 0.05).
Since sensitivity to indiplon is also highly determined by the α subunit involved, we tested two classic benzodiazepines, DZP and flunitrazepam (FZP [5-(2-fluorophenyl)-1,3-dihydro-1-methyl-7-nitro-2H-1,4-benzodiazepin-2-one]), and found that DZP (10 µM) produced a potentiation of 159.5 ± 5% (n = 27) when coapplied with 30 µM GABA. Likewise, FZP (10 µM) potentiated the response to 30 µM GABA by 196.2 ± 13.8% (n = 10). However, potentiation elicited by 1–10 µM DZP was reduced or absent when it was tested at 50–100 µM GABA, a concentration around the EC50, in which case responses were 98 ± 3% (n = 25). Also, drugs derived from β-carboline, which exert their effects through binding to the benzodiazepine site affected the GABA response in OLGs; thus, DMCM and β-CCB (both at 10 µM), two drugs that frequently act as inverse agonists, produced response inhibition (67.7 ± 6%, n = 17) and potentiation (237 ± 21%, n = 13), respectively. These results indicated that in OLGs, the GABAA receptor contains a binding site for benzodiazepines.
On the other hand, loreclezole (10 µM) increased the current to 30 µM GABA, producing a modest but consistent current potentiation to 135 ± 8% (n = 15), suggesting that β2/β3 subunits contribute to native GABAA receptors in OLGs. Finally, we found that Zn2+ strongly inhibited the GABA (100 µM) response, with an IC50 of 8.35 ± 1.9 µM (n = 11), whereas coapplication of 100 µM La3+ had no significant effect (97.5 ± 2% compared with the control response; n = 6). The pharmacological characteristics of OLGs in coculture with neurons at 3–15 DIV were similar to those displayed by OLGs cultured alone and monitored during the first day in vitro.
Increase of Ca2+ Elicited by GABAA Receptor in Myelinating OLGs.
GABA stimulation of OPCs elicits a [Ca2+]i increase when cultured alone (Kirchhoff and Kettenmann 1992). Accordingly, we observed that GABA (0.1–1 mM) induced a rise of basal Ca2+ levels in OLGs from the optic nerve and the forebrain at 1 DIV, a response that was absent at later stages in culture (2–5 DIV). Responses at 1 DIV were observed in 34 ± 10% of the cells and were inhibited when GABA was coapplied with bicuculline (Fig. 7, A and B) or picrotoxin. In contrast, OLGs cocultured with DRG neurons had a robust [Ca2+]i increase (80 ± 3% of the cells were responsive) in response to GABA (100 µM), which was not lost with time in culture (1–6 DIV). Thus, these data indicated that OLGs cocultured with neurons preserve the machinery that generates the Ca2+ response elicited by GABA. Moreover, the [Ca2+]i increase was absent in medium devoid of Ca2+ (n = 15; Fig. 7, C and D). Verapamil (100 µM; n = 15) strongly reduced the Ca2+ increase (Fig. 7E), confirming a major role of voltage-dependent Ca2+ channels in the response, and the increase was abolished by picrotoxin and bicuculline (Fig. 7F).

GABA-evoked [Ca2+]i increase in OLGs cocultured with DRG neurons. Changes in the fluorescence ratio, as an indication of [Ca2+]i, were recorded during the application of different agonists and drugs to isolated OLGs or in coculture with DRG neurons. In (A), isolated cells (1 DIV) were exposed to GABA 100 μM and Ca2+ levels were measured in control conditions and (B) in the presence of bicuculline 100 μM. GABA induced a rapid increase in [Ca2+]i, an effect that was blocked by the inhibitor. Data are presented as the mean ± S.E.M. of 10 cells on the same coverslip. (C) Similar recordings were made in OLGs in coculture with DRG neurons (3–6 DIV). GABA (100 µM) recordings were obtained with an external solution containing 2 mM Ca2+. Paired responses to GABA were obtained from the same cells and were separated by 60-second intervals. (D) Application of GABA (100 µM) in Ca2+-free solution eliminated the response. (E) Coapplication of verapamil and GABA (100 µM) also inhibited the Ca2+ response. (F) The [Ca2+]i increase during the second application of GABA in different cells was normalized against the peak response. The average amplitude of this response was also monitored in the presence of the GABAA channel blocker picrotoxin (100 µM) or the specific antagonist bicuculline (100 µM) (*P < 0.05; ***P < 0.01).
Expression of GABAA Subunits in OLGs In Vitro and In Situ.
Freshly isolated OPCs as well as myelinating and nonmyelinating OLGs express high levels of GABAA receptor α1 and α3 subunit transcripts and intermediate to low levels of β and γ subunits (Cahoy et al., 2008). Accordingly, we found that OLGs cultured alone expressed α1 and α3 subunits at 1 DIV by immunofluorescence; however, the presence of these subunits decreased below detection levels at later stages in culture (3–5 DIV; Fig. 8A). In contrast, in neuron-OLG cocultures (5 DIV or more), levels of α1 and α3 subunits remained stable in OLGs that were in close apposition to axons but not in those lacking such an interaction (Fig. 8B). These immunocytochemical data are consistent with the functional studies described above using electrophysiology and Ca2+ imaging as well as with electron microscopy showing intense immunoperoxidase staining of α1 and α3 subunits in interfascicular OLGs in situ in subcortical white matter (Fig. 9).

Immunocytochemistry of GABAA-α subunits in OLGs maintained in vitro. (A) OLGs maintained for 1 DIV showed reactivity to antibodies against the α1 or α3 subunits (in green) of GABAA receptors. O4 antibody was used to label (in red) premyelinating OLGs at 1 DIV, whereas MBP (in red) expression was observed from 3 to 5 DIV. Immunorecognition of α1 and α3 subunits (in green) was lost in OLGs cultured alone for 3–5 DIV. Bar = 20 µm. (B) Labeling of subunits α1 and α3 (in green) was maintained in OLGs cocultured with DRG neurons in cell cultures kept over 5 DIV in contact with (+) axons. Most of these cells also showed strong MBP immunoreactivity (in red). OLGs in the same coculture without axonal contact lost the label for α subunits but not that for MBP. Bar = 20 µm.

Electron microscopy immunolabeling of GABAA-α1 and GABAA-α3 subunits in mature OLGs of adult rats. (A and B) Subcortical white matter OLGs stained with immunoperoxidase against the GABAA α1 or α3 subunit, respectively. Note the abundant electron-dense precipitate (insets) in the perykarion and membrane and the numerous myelinated axons surrounding the OLG cell bodies.
Discussion
In this study, we provide evidence that OLGs are endowed with functional GABAA receptors, which are readily lost when OLGs are cultured in isolation, but can be maintained by direct axon-to-OLG interaction in cocultures with neurons. The GABA responses observed in our study are similar to those described in isolated OLGs (Von Blankenfeld et al., 1991) and their precursors (Williamson et al., 1998) as well as in OLGs in optic nerve and corpus callosum slices (Berger et al., 1992). In addition, the GABAA receptor-mediated currents described here resemble those reported in NG2+ cells from the adult brain (Lin and Bergles 2004).
GABAA receptors in OLGs undergo a strong downregulation as the cells mature (e.g., Berger et al., 1992), a feature that is confirmed by our data in isolated OLGs. However, in apparent contradiction with that data, we found that GABAA receptor expression and function remain stable over time in OLGs that are in contact with axons, and that α subunits contributing to native GABAA receptors are present in interfascicular OLGs of the adult brain.
Neuron-OLG cocultures have been extensively used to study the mechanisms leading to myelination of the axons (e.g., Chan et al., 2004; Laursen et al., 2009; Wake et al., 2011). Nevertheless, the properties of the neurotransmitter receptors in OLGs have not been thoroughly studied. In the DRG neuron–OLG in vitro preparation used in our study, we observed that GABAA receptor expression required a close interaction between OLGs and axons since OLGs without axonal contacts in the same cultures lost their sensitivity to GABA, and the addition of neuronal conditioned medium to isolated OLGs did not result in the recovery of the GABA responses. The electrophysiological and pharmacological properties of GABAA receptors in OLGs cocultured for several days were similar to those recorded in isolated cells at 1 DIV, suggesting that the subunit composition remains similar or identical during the period maintained in culture. In addition, the increase in [Ca2+]i generated by GABA stimulation was also well maintained in OLGs in coculture. The pharmacology of the Ca2+ response strongly suggested that it was due to the activation of voltage-dependent Ca2+ channels triggered by GABA-mediated depolarization, similar to that shown previously in isolated OLGs (Kirchhoff and Kettenmann, 1992). This indicates that both a depolarizing Cl− gradient and expression of voltage-dependent Ca2+ channels are present in myelinating OLGs.
GABAA receptors are heteromeric in nature and formed by five subunits encoded by 19 known genes that are robustly expressed in the central nervous system. There are no pharmacological tools that conclusively distinguish among distinct possible combinations and therefore we used a battery of ligands to make a preliminary characterization of the GABAA receptors expressed in OLGs in isolation (1 DIV) or in contact with axons (2–7 DIV). We found that the pharmacology of the GABA responses was similar in all the cultures assayed, which suggested that OLGs may all have a specific subtype of GABAA receptors, regardless of their origin (forebrain or optic nerve) or culture conditions (alone or together with DRG neurons). We also confirmed that the GABAA receptors in OLGs may have a unique molecular composition (see, e.g., Velez-Fort et al., 2012). First, we observed a very weak response to THIP, indicating absence of the δ subunit (Meera et al., 2011). This is consistent with the fact that the δ subunit confers sensitivity to inhibition by lanthanum (Saxena et al., 1997), and this polycation had no effect on the OLG GABAA receptor. In sharp contrast to the lack of effect by THIP in OLGs, it has been shown that OPCs in the adult hippocampus do respond to this analog (Lin and Bergles, 2004). Second, potentiation by loreclezole strongly suggests an involvement of the β2/β3 subunits since receptors containing the β1 subunit are insensitive to loreclezole (Wafford et al., 1994). Third, the sensitivity to benzodiazepines (DZP and FZP) favors the idea of γ subunit contribution (Olsen and Sieghart, 2008); however, the response to GABA is insensitive to indiplon and it is inhibited by Zn2+ (Hosie et al., 2003), both of which suggest that the benzodiazepine-binding site expressed in OLGs may not involve the γ2 subunit. We also observed that DZP potentiation only occurs at low GABA (≤ EC30) concentrations. This effect might explain the apparent discrepancy observed in previous studies with respect to the benzodiazepine sensitivity of cells from the oligodendroglial lineage since different GABA concentrations were applied. In one case using ≤ EC30 (Von Blankenfeld et al., 1991), potentiation was reported for FZP, and in other cases applying GABA ≥ EC50, no effect was observed for FZP (Williamson et al., 1998) or DZP (Bronstein et al., 1998) (see also Vélez-Fort et al., 2012). Nonetheless, the presence of the benzodiazepine site in GABAA receptors in OLGs is further supported by the effects of β-carbolines, which are postulated to be endogenous benzodiazepine site modulators (Peña et al., 1986). Thus, DMCM reduced the GABA response as a typical inverse agonist, in agreement with its known properties in other benzodiazepine sites, whereas β-CCB acted to increase the OLG GABA response, an effect that deserves further study (Peña et al., 1986; Rigo et al., 1994).
It is noteworthy that either γ1 or γ3 subunits confer benzodiazepine sensitivity to receptors in heterologous expression studies (Knoflach et al., 1991; Puia et al., 1991), and that receptors with these subunits have also been shown to be insensitive to other pyrazolopyrimidine molecules, such as zolpidem (e.g., Puia et al., 1991), in a way similar to that shown here for indiplon. Thus, potentiation by benzodiazepines and insensitivity to indiplon are consistent with the involvement of γ1 or γ3 subunits in the GABAA receptor expressed in OLGs. An inconsistency seems to emerge with the inhibitory effect of Zn2+ since there is no evidence indicating that receptors with γ1 or γ3 subunits might be sensitive to Zn2+, mainly because the residues involved in Zn2+ binding site disruption are conserved in the three γ subunits of GABAA receptors (Hosie et al., 2003; Trudell et al., 2008); clearly, further analysis is required to solve this important issue.
It is also important to note that these OLG receptors presented a rather high EC50 for GABA (close to 80 µM) compared with many other receptors expressed in the nervous system. This characteristic suggests an involvement of the α3 subunit (Williamson et al., 1998) since in heterologous expression studies, this subunit confers a low sensitivity to GABA receptors when coexpressed with either β2 (Sigel et al., 1990) or β3 subunits (Böhme et al., 2004).
On the other hand, the pharmacological profile of the GABAA receptors observed in our study corresponds well with the functional genomics analysis carried out in OLGs, which shows a high expression of α1 and α3, along with moderate levels of β2 or β3 subunits and low levels of γ1 and γ2 subunits (Cahoy et al., 2008). Accordingly, immunofluorescence studies in vitro demonstrated the presence of α1 and α3 subunits in OLGs cocultured with neurons, and immunoperoxidase staining of adult brain sections showed intense labeling of these subunits in interfascicular OLGs. Together with functional studies, our results suggest a contribution of α3, β2/β3, and γ1/γ3 subunits to the GABAA receptors in OLGs. However, this does not exclude the involvement of other subunits since the final pharmacological properties result from a complex interplay conferred by multisubunit participation in binding sites formation for either GABA, benzodiazepine, or Zn2+ (Olsen and Sieghart, 2008; Sieghart, 2015). In addition, during the period of postnatal development, extensive changes in the expression for different GABAA subunits in the nervous system occur (Laurie et al., 1992). Thus, the characteristics for GABAA receptors expressed by OLGs in culture conditions at this age must be confirmed in more integral preparations.
The axon-to-OLG signals regulating the stabilization of OLG GABAA receptors remain unknown. Blockade of neuronal activity with tetrodotoxin did not change OLG sensitivity to GABA, which suggests that basal neuronal activity was not necessary to drive GABAA receptor expression in OLGs. Conversely, chronic activation of GABAA receptors with GABA or their blockade by either Zn2+ or bicuculline in cerebellar organotypic cultures did not alter MBP expression levels (data not shown). Nevertheless, GABAA receptors in OLGs and their precursors may be crucial for proper myelination and remyelination after injury since disruption of GABAergic communication in NG2-expressing progenitor cells during cerebellar development results in a delay of OLG maturation and dysmyelination (Zonouzi et al., 2015).
In summary, we have shown here that premyelinating and myelinating OLGs from the optic nerve and forebrain in contact with axons have a robust sensitivity to GABA, which acts on a GABAA receptor subtype, with distinctive functional and pharmacological characteristics. Expression of GABAA receptors in OLGs was controlled by a mechanism that depended on their contact with axons during the premyelinating stage. GABAA receptor activation causes depolarization of OLGs, and an increase in [Ca2+]i that may be relevant for myelination and remyelination after injury.
Acknowledgments
The authors thank Saioa Marcos and Dr. Edith Garay for technical assistance, and Dr. Dorothy D. Pless for editing the manuscript. R.O.A. was supported by Ikerbasque, Bizkaia Talent, and the Programa de Apoyos para la Superación del Personal Académico de la Universidad Nacional Autónoma de México.
Authorship contributions
Participated in research design: Arellano, Matute, Sánchez-Gómez.
Conducted experiments: Arellano, Matute, Sánchez-Gómez, Alberdi, Canedo-Antelo, Pérez-Samartín, Chara, Palomino.
Performed data analysis: Arellano, Matute, Sánchez-Gómez, Alberdi, Canedo-Antelo, Chara, Palomino.
Wrote or contributed to the writing of the manuscript: Arellano, Matute, Sánchez-Gómez, Pérez-Samartín.
Footnotes
- Received June 29, 2015.
- Accepted November 3, 2015.
This study was funded by the Ministerio de Economía y Competitividad/Fondos Europeos de Desarrollo Regional [Grants SAF2010-21547 and SAF2013-45084-R] and the Centro de Investigación Biomédica en Red en Enfermedades Neurodegenerativas [Grant PRY-15-404].
Some information reported herein was presented as follows: Arellano RO, Sánchez-Gómez MV, Alberdi E, Canedo M, Palomino A, Pérez-Samartín A, and Matute C (2015) Neuron and glia interaction regulates GABAA receptor expression in the oligodendrocyte membrane. XII European Meeting on Glial Cells in Health and Disease; on July 15 and 16, 2015; Bilbao, Spain. Network Glia, Berlin, Germany.
Abbreviations
- β-CCB
- butyl β-carboline-3-carboxylate
- DIV
- days in vitro
- DMCM
- 4-ethyl-6,7-dimethoxy-9H-pyrido(3,4-b)indole-3-carboxylic acid methyl ester
- DRG
- dorsal root ganglion
- DZP
- diazepam [7-chloro-1-methyl-5-phenyl-3H-1,4-benzodiazepin-2(1H)-one]
- FZP
- flunitrazepam [5-(2-fluorophenyl)-1,3-dihydro-1-methyl-7-nitro-2H-1,4-benzodiazepin-2-one]
- Glut
- glutamine
- HK+
- high K+
- loreclezole
- (Z)-1-[2-chloro-2-(2,4-dichlorophenyl)ethenyl]-1H-1,2,4-triazole
- MBP
- myelin basic protein
- OLG
- oligodendrocyte
- OPC
- oligodendrocyte precursor cell
- PBS
- phosphate-buffered saline
- PDGFRα
- platelet-derived growth factor receptor-α
- THIP
- 4,5,6,7-tetrahydroisoxazolo(5,4-c)pyridin-3-ol hydrochloride
- Copyright © 2015 by The American Society for Pharmacology and Experimental Therapeutics


