


Abstract
In prior work, we have shown that it is possible to estimate the product of observed affinity and intrinsic efficacy of an agonist expressed relative to that of a standard agonist simply through the analysis of their respective concentration-response curves. In this report, we show analytically and through mathematical modeling that this product, termed intrinsic relative activity (RAi), is equivalent to the ratio of microscopic affinity constants of the agonists for the active state of the receptor. We also compared the RAi estimates of selected muscarinic agonists with a relative estimate of the product of observed affinity and intrinsic efficacy determined independently through the method of partial receptor inactivation. There was good agreement between these two estimates when agonist-mediated inhibition of forskolin-stimulated cAMP accumulation was measured in Chinese hamster ovary cells stably expressing the human M2 muscarinic receptor. Likewise, there was good agreement between the two estimates when agonist activity was measured on the ileum from M2 muscarinic receptor knockout mice, a convenient assay for M3 receptor activity. The RAi estimates of agonists in the mouse ileum were similar to those estimated at the human M3 receptor with the exception of 4-(m-chlorophenyl-carbamoyloxy)-2-butynyltrimethylammonium (McN-A-343), which is known to be an M1- and M4-selective muscarinic agonist. Additional experiments showed that the response to McN-A-343 in the mouse ileum included a non-M3 muscarinic receptor component. Our results show that the RAi estimate is a useful receptor-dependent measure of agonist activity and ligand-directed signaling.
Drug discovery often involves testing compounds in high-throughput screens to determine their activity at specific receptors. The process not only identifies useful drugs but also helps to explain how variation in the structure of a compound alters its pharmacological activity. With regard to agonists at G protein-coupled receptors (GPCRs), the most common measurements of functional activity are the maximal response (Emax) and the concentration of agonist required for half-maximal response (EC50). These parameters can vary for the same agonist, however, depending on the coupling protein through which the receptor signals (e.g., G protein) and the nature of the response being measured. What is needed is a measure of agonist activity that is dependent solely on the agonist-receptor interaction and not on downstream elements in the signaling cascade.
To identify such a measure, it is useful to consider that the activity of an agonist can be analyzed at different, internally consistent, hierarchical levels as summarized in Fig. 1. Ultimately, agonist action depends on the microscopic affinity constants of the agonist for the ground and active states of the receptor (Colquhoun, 1998; Ehlert, 2000). These parameters have been estimated at ligand-gated ion channels through the analysis of single-channel activity (Colquhoun and Sakmann, 1985), but it is impossible to estimate all of these parameters through the analysis of a downstream response at GPCRs. If we take a less detailed view of agonist action and consider the activity of a population of receptors, it is possible to determine the relationship between the agonist concentration and the fraction of the receptor population in the active state. At a ligand-gated ion channel, this measurement represents the ensemble average or whole-cell current elicited by the agonist. At a GPCR, this activation function is known as the stimulus, and it can be estimated through the analysis of a downstream response using the method of partial receptor inactivation (Furchgott, 1966). The analysis yields estimates of the concentration of agonist required for half-maximal receptor activation (observed dissociation constant) and the maximal level of receptor activation at 100% receptor occupancy (observed intrinsic efficacy). Affinity and efficacy are not fundamental constants unique to the specific agonist-receptor complex; rather, these parameters are complex functions of the microscopic affinity constants of the ground and active states of the receptor as well as other constants (Ehlert, 2000, 2008). This complexity is manifest, in part, by their dependence on the concentration of GTP and on other proteins that physically interact with the receptor (e.g., G proteins). Thus, although observed affinity and intrinsic efficacy are more invariant than the empirical parameters, EC50 and Emax, they are not solely dependent on the agonist-receptor complex. In addition, the requisite data for estimating observed affinity and intrinsic efficacy are rarely obtained in high-throughput screens.

Hierarchical levels of the analysis of agonist action. a, at the deepest level of analysis, the activity of an agonist is determined by its microscopic affinity constants for ground (Ka) and active (Kb) states of the receptor and the equilibrium between these states (Kq). b, at a more superficial level of analysis, one can consider the amount agonist-receptor complex in the form of the active state as a function of the agonist concentration with respect to a population of receptors. This function represents the stimulus. Its maximum is defined as observed intrinsic efficacy (ϵ), and the concentration of agonist required for half-maximal formation of the active state of the receptor represents the observed dissociation constant (Kobs). The parameters ϵ and Kobs are complex functions of the microscopic affinity constants described in a as well as other parameters related to the coupling proteins that physically interact with the receptor (e.g., G protein). c, at the most superficial level of analysis, agonist activity can be defined by the behavior of its concentration-response curve for eliciting a downstream response. The Emax and EC50 values of this response depend on a variety of parameters including the microscopic affinity constants described in a.
In the present report, we show analytically and through mathematical modeling that the microscopic affinity constant of an agonist for the active state of the receptor is proportional to the product of its observed affinity and intrinsic efficacy, and that this relationship holds when there are different active states of the receptor signaling through different G proteins. We have shown previously that it is possible to estimate the product of observed affinity and intrinsic efficacy of an agonist expressed relative to that of a standard agonist simply through the analysis of their respective concentration-response curves (Griffin et al., 2007; Ehlert, 2008). This estimate is known as the intrinsic relative activity (RAi) of the agonist. In this report, we also show that the RAi values of agonists, estimated from their concentration-response curves, are equivalent to the product of observed affinity and intrinsic efficacy determined through the method of partial receptor inactivation. These assays were carried out on Chinese hamster ovary cells stably expressing the human M2 muscarinic receptor (CHO hM2 cells) and on the ileum from M2 muscarinic receptor knockout mice (M2 KO), which is a convenient assay system for M3 activity. Thus, although observed affinity and intrinsic efficacy are complex functions of microscopic constants, their product expressed relative to that of a standard agonist yields a single fundamental parameter: namely, the microscopic affinity constant of the active state of the receptor expressed relative to that of the standard agonist. This constant is solely dependent on agonist-receptor complex and is easily estimated from the agonist concentration-response curve using global nonlinear regression analysis.
Materials and Methods
Mice. The muscarinic M2 receptor knockout (M2 KO) and the M2/M3 double receptor knockout (M2/M3 KO) were generated previously by Matsui et al. (2000, 2002) in C57BL/6 mice. Only male knockout mice were used in our studies.
Isolated Ileum. Mice were euthanized with CO2, and the ileum was dissected out and mounted in an organ bath containing Krebs-Ringer-bicarbonate buffer (124 mM NaCl, 5 mM KCl, 1.3 mM MgCl2, 26 mM NaHCO3, 1.2 mM KH2PO4, 1.8 mM CaCl2, and 10 mM glucose) gassed with O2/CO2 (19:1). Contractions were measured and recorded as described previously (Matsui et al., 2003). For each tissue, the contractile responses were normalized relative to the contraction elicited by KCl (50 mM). Competitive muscarinic antagonists were allowed to incubate with the tissue 30 min before measuring contractile response to an agonist. When N-(2-chloroethyl)-4-piperidinyl diphenylacetate (4-DAMP mustard) was used, it was first cyclized at 37°C for 30 min to allow the formation of the aziridinium ion as described previously (Thomas et al., 1992). Isolated ileum was incubated with 4-DAMP mustard (10 nM) for 20 to 40 min depending on the agonist. We always estimated the dissociation constant of the standard agonist in the same experiment in which that of a test agonist was estimated. The entire process was repeated for each test agonist.
cAMP Accumulation. CHO cells stably transfected with the human M2 muscarinic receptor (CHO hM2) were provided by Acadia Pharmaceuticals (San Diego, CA) and cultured in Dulbecco's modified Eagle's medium containing 10% fetal bovine serum, penicillinstreptomycin (100 U/ml), and G418 (0.3 mg/ml). The cells were grown in a humidified atmosphere at 37°C with 5% CO2. We used the [3H]adenine prelabeling method of Schultz et al. (1972) to measure cAMP accumulation in detached CHO cells, essentially as described previously (Griffin et al., 2007). The incubations with agonist were carried out at 37°C for 12 min in Krebs-Ringer bicarbonate buffer containing isobutyl methylxanthine gassed with O2/CO2 (19:1). In due course, [3H]cAMP was separated from [3H]ATP using a method similar to that described by Salomon et al. (1974). Before use, 4-DAMP mustard was cyclized as described above in experiments on the ileum. The dissociation constant of each agonist was estimated in separate experiments using the method of partial receptor inactivation with 4-DAMP mustard. For each test agonist, a control concentration-response curve to the standard agonist carbachol was measured in the same experiment.
Estimation of Observed Affinity and Relative Efficacy. A modification of Furchgott's method of partial receptor inactivation (Furchgott, 1966) was used to estimate the dissociation constants of agonists. After partial receptor inactivation with 4-DAMP mustard, agonist concentrations were interpolated on the control concentration-response curve (Xi) corresponding to the responses ( ) of the concentration-response curve measured after partial receptor inactivation. For experiments on cAMP accumulation in CHO hM2 cells, the agonist concentrations were interpolated using the following equation:
  where T, Emax,EC50, and n represent the parameters of the control concentration-response curve. These are defined as the amount of cAMP accumulation stimulated by forskolin in the absence of agonist (T), the maximal percentage of inhibition of cAMP accumulation elicited by the agonist (Emax), the concentration of agonist causing half-maximal inhibition of cAMP accumulation (EC50), and the Hill slope (n). These parameters were estimated from the concentration-response curve by nonlinear regression analysis using the dose-response function in GraphPad Prism 4.0 (GraphPad Software Inc., San Diego, CA). For experiments on the ileum from M2 KO mice, the following equation was used to interpolate agonist concentrations:
  in which Emax and EC50 denote the maximal response and concentration of agonist eliciting half-maximal response for the control concentration-response curve, n denotes the Hill slope, and B denotes the resting tension measured in the absence of agonist. After determining pairs of equiactive agonist concentrations from the concentration-response curves under control (Xi) and 4-DAMP mustard treated conditions (
 ), the data were fitted to the following equation by nonlinear regression analysis (Ehlert, 1987):
  in which Kobs denotes the observed dissociation constant of the agonist and q denotes the fraction of residual, active receptors after inactivation with 4-DAMP mustard. The relative efficacy values of agonists were estimated using the principles outlined by Furchgott and Bursztyn (1967). Knowing the dissociation constants of the agonists, it is possible to plot response against log receptor occupancy for each assay system (i.e., CHO M2 and M2 KO ileum). The response-occupancy plots of the standard agonist and each test agonist for a given assay system were fitted simultaneously by global nonlinear regression analysis to the following logistic equation:
  in which O denotes receptor occupancy, m denotes the transducer slope factor, Msys denotes the maximum response of the system, and τ is a parameter in the operational model (Black and Leff, 1983) related to intrinsic efficacy (ϵ), receptor density (RT) and the sensitivity of the signaling pathway (KE) (i.e., τ = ϵRT/KE). Regression analysis was done sharing the estimate of Msys and m among the curves and obtaining unique estimates of τ for each agonist. The efficacy of the test agonist X (ϵX) expressed relative to that of a standard (ϵY) is simply calculated as
Estimation of RAi. Two methods were used to estimate RAi:a null method, and a method based on the operational model. The former is independent of the relationship between occupancy and response, and the latter is based on a logistic relationship between the two. The theoretical basis for estimation of RAi is given by Griffin et al. (2007), and step-by-step instructions for its estimation are given by Ehlert (2008). For the null method, equiactive agonist concentrations for the standard (Y) and test (X) agonists are determined using a procedure similar to that described above for the Furchgott analysis. The logarithms of the equiactive agonist concentrations were fitted to the following equation by nonlinear regression analysis: in which log(KY) denotes the log dissociation constant of the standard agonist, log(P) denotes the log ratio of the dissociation constant of the test agonist divided by that of the standard [log(KX/KY)] and log RAi is defined as the log of the product of the observed affinity (1/KX) and intrinsic efficacy (ϵX) of the test agonist divided by that of the standard agonist (product of 1/KY and ϵY, respectively):
  As described previously (Griffin et al., 2007), if the standard agonist is a full agonist, then there are an infinite number of parameter estimates that give a least-squares fit. This infinite solution set consists of a single estimate of log(RAi) and an infinitely large, inversely correlated set of values for log(KY) and log(P). To obtain the least-squares fit, log(KY) is set to an arbitrarily high constant (e.g., -1) during regression analysis. Regression analysis yields the best estimate of log(RAi) and an estimate of log(P) that is perturbed from its true value depending on the arbitrary constant to which KY was set during regression analysis. Regardless, it is possible to obtain an accurate estimate of KX by simply multiplying the constant to which KY was fixed during regression analysis by the estimate of P. Therefore, using logarithms, log(KX) is calculated as
  In summary, if the standard agonist is a full agonist, regression analysis yields estimates of log(RAi) and, ultimately, the log dissociation constant of the test agonist [log(KX)].
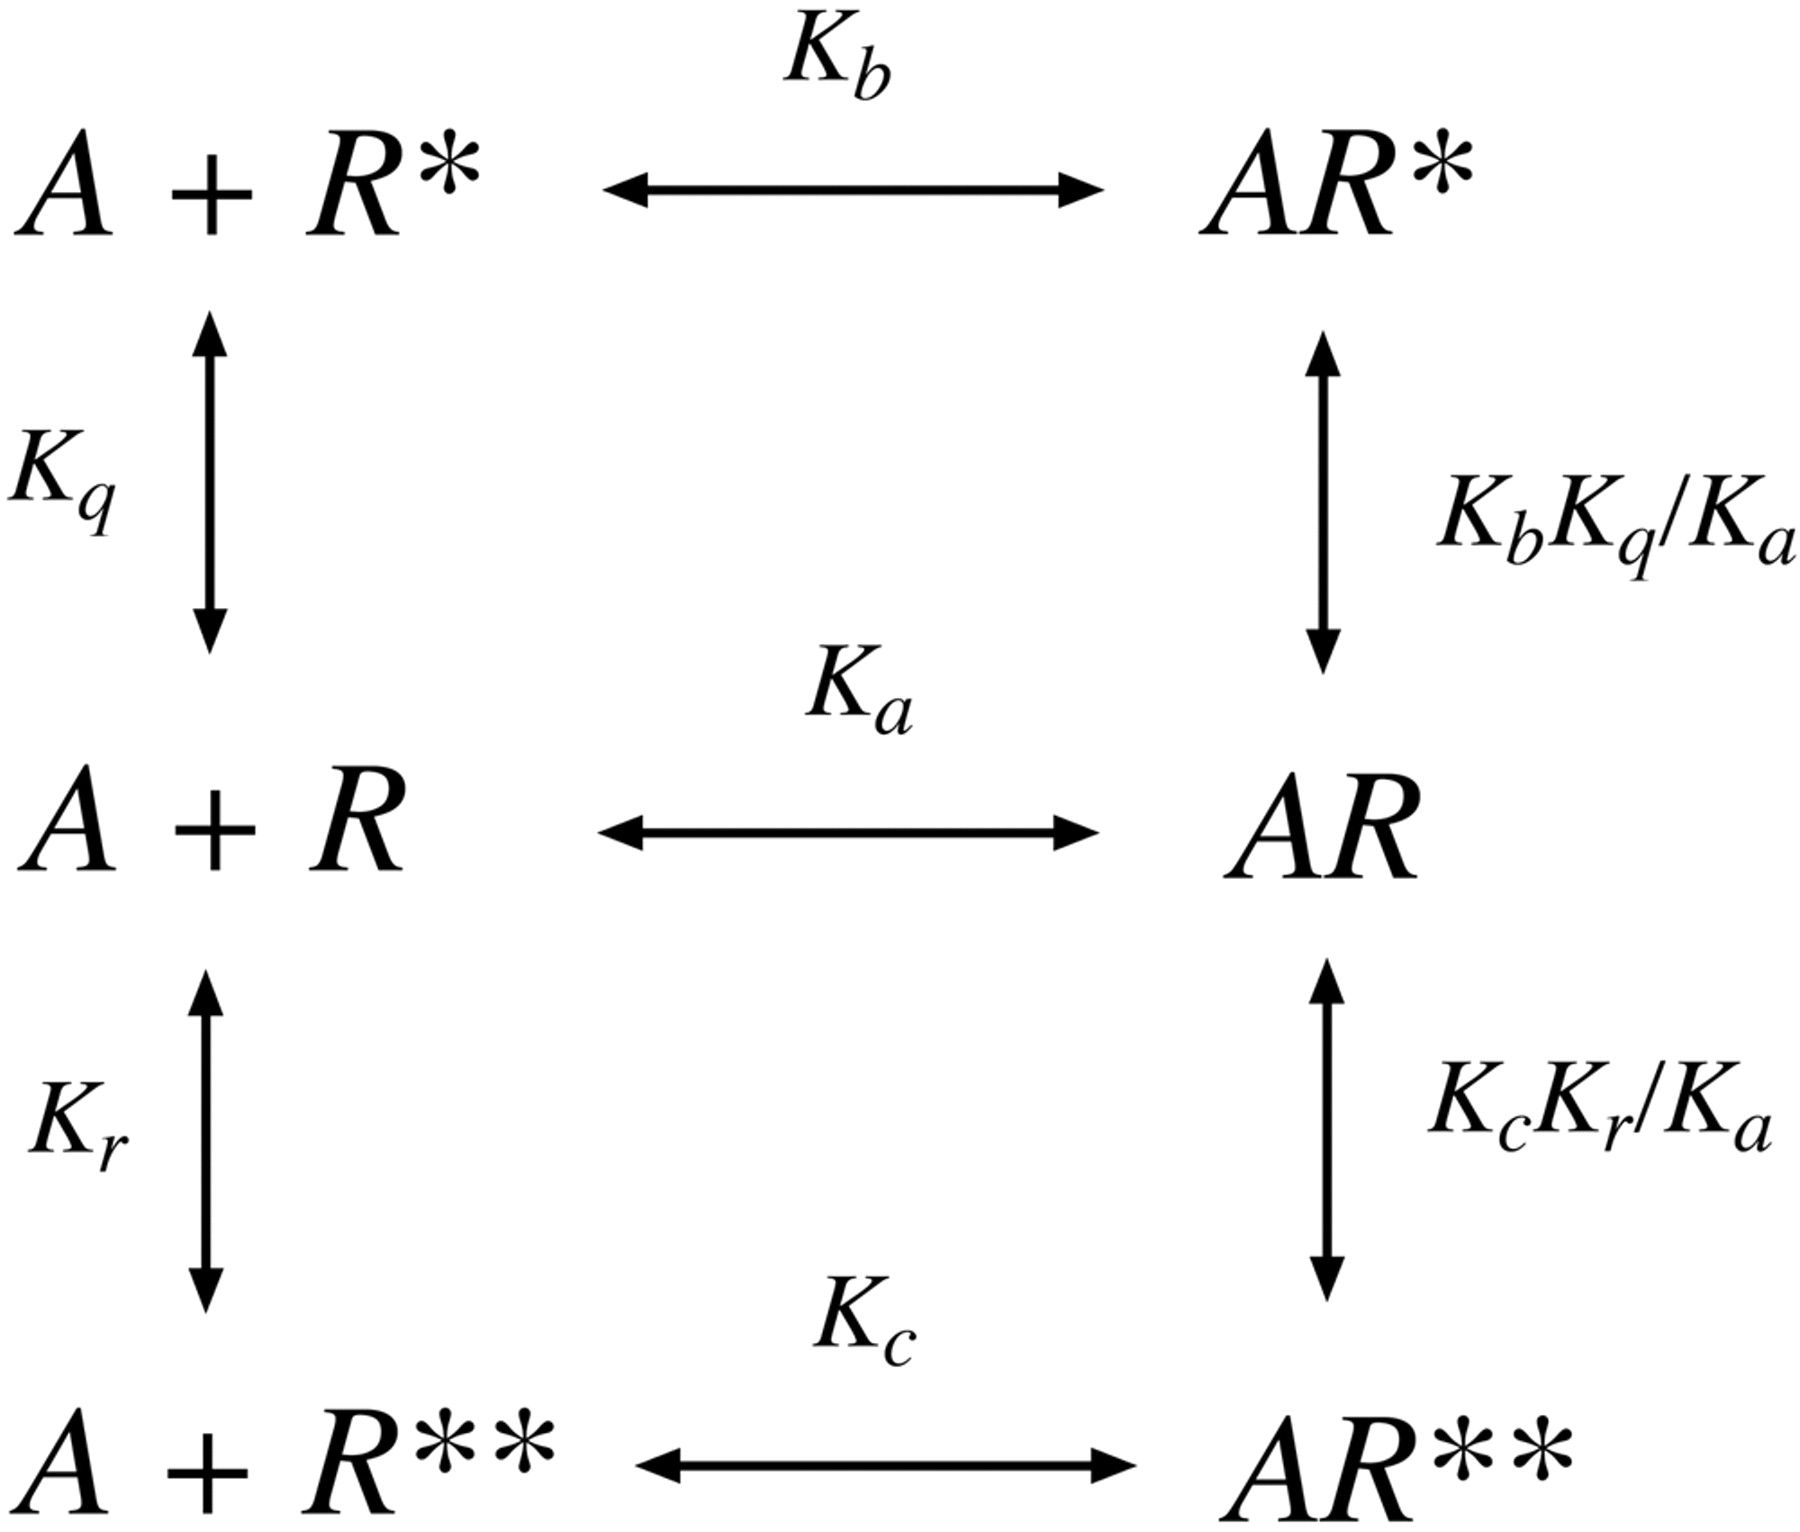
Scheme for the interaction of an agonist (A) with a receptor having a single inactive (R) and two active (R* and R**) states.
For estimating RAi using the operational model, the concentration-response curves of the standard and test agonists were analyzed simultaneously by global nonlinear regression analysis using the following two equations:
In these equations, M denotes the maximum response of the system, N denotes the transducer slope factor, and R denotes the ratio τY/KY. Global nonlinear regression analysis is done fitting eq. 9 to the concentration-response curve of the standard agonist and eq. 10 to those of the test agonists. As described previously (Griffin et al., 2007), if the standard agonist is a full agonist, then there are an infinite number of parameter estimates that give a least-squares fit. This infinite solution set, however, consists of a single estimate of log(RAi) and an infinite set of log(KY) values bounded by the range, log(KY) is greater than or equal to its actual value. Therefore, it is possible to obtain a least-squares fit by setting log(KY) to an arbitrarily high constant (e.g., -1) for the global nonlinear regression analysis. During regression analysis, the estimates of M and N are shared among the curves, and unique estimates of log(R), log(KX), and log(RAi) are obtained.
Materials. The muscarinic agonists including carbachol, oxotremorine-M, oxotremorine, arecoline, pilocarpine, bethanechol, and McN-A-343, as well as isobutylmethylxanthine, tetrodotoxin, atropine, G 418, adenine and neutral alumina, were obtained from Sigma-Aldrich (St. Louis, MO). Other reagents were obtained from the following sources: pirenzepine (Research Biochemicals International, Natick, MA); Dulbecco's modified Eagle's medium and penicillin-streptomycin (Invitrogen, Carlsbad, CA); [3H]adenine (PerkinElmer Life and Analytical Sciences, Waltham, MA); forskolin (Calbiochem, San Diego, CA); and Dowex AG 50W-X4 (Bio-Rad Laboratories, Hercules, CA). (S)-Aceclidine was synthesized as described previously by Ringdahl et al. (1979).
Results
Mathematical Modeling
Relationship between RAi and the Microscopic Affinity Constants of Agonists. As described previously, the RAi value is equivalent to the product of observed affinity and intrinsic efficacy of an agonist expressed relative to that of a standard agonist. All that is required for estimation of RAi are the concentration-response curves of the agonists. First, we show analytically that the product of observed affinity and intrinsic efficacy of an agonist, expressed relative to that of another agonist, is equivalent to the corresponding ratio of microscopic affinity constants of the agonists for the active state of the receptor. In our analysis, we assume that the receptor is in equilibrium between ground (R) and active states (R* and R**) as shown in Fig. 2. Two active states of the receptor were considered so that it would be possible to address the question of ligand-directed signaling, which involves the preferential coupling of different active states to different coupling proteins (e.g., G proteins). The details of our solution are given under the Appendix, and a schematic summary of our results is shown in Fig. 3. The figure shows the active state of the agonist-receptor complex plotted against the concentration of agonist. Curves for two agonists, A and B, are shown. The maximum of their receptor activation functions is equivalent to observed intrinsic efficacy (ϵ), and the concentration of agonist required for half-maximal formation of the active receptor complex is equivalent to the observed dissociation constant (Kobs). The mathematics described under Appendix show that the product of observed affinity (1/Kobs-B) and intrinsic efficacy (ϵB) of agonist B divided by the corresponding product for A [(1/Kobs-A)ϵA] is equivalent to the microscopic affinity constant of agonist B for the active state (Kb) divided by that for agonist A ( ).
).
Next, we simulated agonist concentration-response curves and estimated the RAi value of an agonist relative to a standard agonist. From this analysis, it is possible to determine the dependence of the RAi value on the microscopic affinity constants of the agonists. Our model is based on the assumption that the stimulus (i.e., product of receptor occupancy and observed intrinsic efficacy) (Furchgott, 1966) is proportional to the amount of active, agonist-receptor complex in the form of a quaternary complex consisting of agonist, receptor, G protein, and guanine nucleotide (AR*GX) (Ehlert and Rathbun, 1990; Ehlert, 2000). We used methods described previously to simulate the amount of agonist complex in the AR*GX complex based on theoretical values for the microscopic affinity constants of the agonist for different states of the receptor (Ehlert, 2008). To broaden the relevance of the model, we considered a receptor with two different active states, each interacting with a different G protein. This condition accounts for the phenomenon of ligand-directed signaling (Leff et al., 1997). A pictorial representation of the model is shown in Fig. 4, and the details of the calculations and definitions of the parameters are given in Ehlert (2008). Additional details of the model for a single active state are described in Ehlert (2000), and a description of the equation used to do the modeling is listed in the Appendix.

Summary of the relationships between the stimuli of two agonists, A and B, and the ratio of the microscopic affinity constant of agonist B for the active state of the receptor divided by that for A. Theoretical plots for the amount of agonist bound to the receptor in the form of the active state is shown for the two agonists. The curves are based on the model shown in Fig. 2 and were estimated using eqs. 14 to 16 under Appendix. The maximal amounts of active, agonist-receptor complex formed at high concentrations of A and B are denoted as ϵA and ϵB, and the concentrations of agonists required for half-maximal formation of these complexes are Kobs-A and Kobs-B, respectively. The parameter RAi denotes the product of the observed affinity and intrinsic efficacy of agonist B expressed relative to that of A. The mathematics described under Appendix show that this parameter is simply equal to the microscopic affinity constant of agonist B for the active state of the receptor divided by that for agonist A.
Figure 5 illustrates the results of our simulations, which were done with the concentration of GTP set at a nearly saturating value (1 mM). The parameters of the model where chosen so that agonist A stimulates signaling through the two G proteins, G1 and G2, to the same extent, whereas agonist B exhibits a preference for signaling through G1. Figure 5, a to d, show theoretical predictions for the two agonists (A and B) acting on a receptor in a dynamic equilibrium with G1 and G2 (dynamic equilibrium case). In this example, the microscopic affinity constants of agonist A and B for the ground state of the receptor ( and Ka, respectively) were set to the same value (i.e., 105). Likewise, the microscopic affinity constants of A and B for the active state (R*) that preferentially interacts with G1 are also set to the same value (
 = Kb = 109). In contrast, the microscopic affinity constant of agonist A for the active state (R**) that preferentially interacts with G2 (
 ) was set to 109, whereas the corresponding constant for agonist B was assigned a lower value (Kc = 108). Using these microscopic constants and others described under Appendix (independent variables), it is possible to simulate the amount of agonist-receptor-G protein complex in the active state bound with guanine nucleotide, as well as the downstream concentration-response curve (dependent variables). This output was generated using equations described under Appendix. This output also yields the dependent parameters, observed affinity and intrinsic efficacy, as well as the EC50 and Emax values of the downstream, concentration-response curve. Figure 5, a and b, shows the output from the system through the G1 pathway. The amount of the active state (R*) of the receptor in the form of quaternary complex is shown in Fig. 5a for agonists A and B (AR*G1X and BR*G1X, respectively). The maximal amount of active quaternary complex formed by agonist B (56%) is greater than that of A (37%) even though the selectivity of agonists A and B for the R* state is the same (
 = Kb/Ka = 104). The maximum is proportional to observed intrinsic efficacy of the agonist-receptor complex for signaling through G1 (ϵ1). The different ϵ1 values of the agonists is caused by competition of the two G proteins with the two different active states of the receptor (R* and R**). With regard to agonist A, this competition is equal because
  = 104. In contrast, with agonist B, the competition is shifted in favor of G1 because
  >
>  . The EC50 values of the agonists for half-maximal formation of the quaternary complex with G1 are equivalent to the observed dissociation constant (Kobs). When expressed as negative logarithms (pKobs) the values for agonist A and B are 5.65 and 5.47, respectively. Kobs is a function of the microscopic constants (Ka, Kb, and Kc) and other parameters. Because the Kc value of agonist B is 10-fold lower than that of A (
 ), then the Kobs value of agonist B exhibits lower potency than that of A. The plot of quaternary complex as a function of the agonist concentration represents the stimulus, and this function was substituted into the operational model (Black and Leff, 1983) to generate a theoretical concentration-response curve for each agonist (Fig. 5b). These were generated with an operational model having a moderately sensitive signaling cascade (KE = 0.03; Fig. 5), resulting in a receptor reserve. Even though the stimuli generated by the agonists differ, the resulting concentration-response curves for signaling through G1 are identical, with EC50 values of 0.2 μM and Emax values of 100%. The indistinguishable curves yield an RAi value of agonist B relative to A of 1.0. This value is equivalent to the ratio of the microscopic affinity constant of agonist B for the active state of the receptor (Kb) divided by the corresponding constant (
 ) for A (i.e., Kb/
 = 109/109 = 1.0). It can also be shown that the RAi is equivalent to the product of affinity (1/Kobs-B) and intrinsic efficacy (ϵ1-B) of agonist B divided by the corresponding product for agonist A. Relative to agonist A, the higher intrinsic efficacy of agonist B is offset by a lower observed affinity, resulting in an RAi value of 1.0. Table 1 summarizes the dependent parameters of the simulated data in Fig. 5, a and b.
Simulation of ligand directed signaling for a receptor in dynamic equilibrium with two different G proteins at the same time or in segregated equilibria

Model for ligand-directed signaling. The interaction of a nonselective agonist (A) and selective agonist (B) with a receptor signaling through two different G proteins (G1 and G2) in the presence of guanine nucleotides (GTP and GDP). The receptor exists in two different active conformations (R* and R**), each being selective for a different G protein (G1 and G2, respectively). Agonist A exhibits equivalent high affinity for R* and R**, whereas agonist B exhibits selectivity for R**. The stimulus is proportional to the amount of active agonist-receptor complex in the form of a quaternary complex consisting of agonist-receptor-G proteinguanine nucleotide. The amount of the latter is proportional to agonist-induced guanine nucleotide exchange.
Figure 5, c and d, summarizes the theoretical curves for responses mediated through the R** active conformation of the receptor, which preferentially signals through a different G protein (G2). Figure 5c shows the theoretical curves for the active quaternary complex of each agonist (AR**G2X and BR**G2X) plotted against the agonist concentration. Because the receptor is in a dynamic equilibrium with two G proteins, the Kobs values of the agonists are the same as those shown in Fig. 5a for signaling through G1. In contrast the maximal amount of quaternary complex formed by agonist B (BR**G2Xmax) is much less than that shown in Fig. 5a for the corresponding G1 complex (BR*G1Xmax), which correlates with the lower Kc/Ka ratio (103) compared with Kb/Ka (104). Figure 5d shows the theoretical concentration-response curves of the two agonists for eliciting a response downstream from G2. The lower activity of agonist B is readily apparent from the figure, and its RAi value relative to agonist A was estimated to be 0.1. This RAi value accurately predicts the ratio of the microscopic affinity constant of agonist B for the active state (Kc) relative to that of agonist A ( ) (i.e., Kc/
 = 108/109 = 0.1). The theoretical curves shown in Fig. 5, a to d, show that agonist B directs signaling through G1 relative to G2 and that this selectivity is accurately reflected in its higher RAi value for the G1 response relative to that of G2.
These simulations were repeated with the same parameters, but with the equilibrium between the receptor and G proteins segregated into two distinct equilibriums: one for R and G1 (Fig. 5, e and f) and another for R and G2 (Fig. 5, g and h) (segregated equilibrium case). The results were qualitatively similar to those shown for the dynamic equilibrium case. One difference is that the Kobs value of agonist B for eliciting responses through G1 is different from that for eliciting responses through G2. Nonetheless, the RAi values of agonist B for eliciting responses through G1 are the same in the both dynamic equilibrium and segregation cases (Fig. 5, b and f), and the same is true for the RAi values for G2 responses (Fig. 5, d and h).
Table 1 summarizes the results of the simulations shown in Fig. 5. In each case, it can be shown that the product of observed affinity and intrinsic efficacy of agonist B expressed relative to A is equivalent to RAi. In addition, the latter estimate is equivalent to the ratio of the microscopic affinity constant of agonist B for the active state expressed relative to that of A, and that the RAi value is unaffected by segregation of the G proteins into two separate pools.
Summary of Simulations Using a Diverse Range of Parameter Values. We investigated a wide range of parameter values (microscopic constants) for the model shown in Fig. 5 to ensure that our conclusions were not dependent on the particular parameters used in Fig. 5. These additional simulations showed the same result: namely, that the RAi value is equivalent to the ratio of microscopic affinity constants of the agonists for the active state of the receptor. In these simulations, we kept the level of constitutive activity to a minimum and the affinity of guanine nucleotide for the G protein much lower when the activated receptor is associated with it compared with the inactive receptor. This condition results in a high degree of negative cooperativity between the binding of guanine nucleotide (GDP or GTP) and a highly efficacious agonist with the receptor-guanine nucleotide complex, which is a basic requirement for agonist-induced guanine nucleotide exchange. With these two constraints, we found that RAi was equivalent to the ratio of microscopic affinity constants of the two agonists for the active state of the receptor regardless of the parameter values, including a variation in the concentration of GTP.
Our analysis is also appropriate for a receptor system exhibiting substantial constitutive receptor activity, because the basis of our approach rests on the agonist-induced response above basal activity. Using our method, however, it would not be possible to compare the activity of an agonist with that of an inverse agonist. Nonetheless, it would be possible to use an analogous approach to compare the activity of a series of inverse agonists with a standard inverse agonist in a system with constitutive receptor activity. In this instance, if the response were defined as the inhibition of basal activity, then the corresponding measure of RAi would be equivalent to a relative estimate of the microscopic affinity constant of the ground state of the receptor.
A potential criticism of our modeling is the use of a simple equilibrium constant to describe the interaction between receptor and G protein within the membrane. This type of constant is usually used to define the relationship between the concentrations of bound and free ligand and receptor in solution. We do not envision this constant in the same light, but rather as a simple constant describing a reversible interaction between two proteins in the membrane. The two-dimensional constraints of the membrane and the involvement of potential scaffolding proteins in the interaction raises the issue of a possible limiting supply of G protein in the local environment. We explored this issue by taking into account depletion in the concentration of G protein as described previously (Ehlert 2000) and explored a range of ratios of G protein to receptor, including very low ratios (0.1). Under this condition, we also varied the other parameters described above, and in each case, found that the RAi estimate was essentially equivalent to the ratio of microscopic affinity constants of the two agonists for the active state of the receptor.

Simulation of ligand directed signaling for a receptor in equilibrium with two different G proteins at the same time (a-d; dynamic equilibrium case) or independently (e-h; segregated equilibrium case). In each case, the microscopic affinity constant of agonist A for the two active states of the receptor (R* and R**) was the same (Kb = Kc = 109), whereas agonist B exhibited selectivity for R* ( = 109) compared with R**
 = 108). The microscopic affinity constants of the agonists for the ground state of the receptor (R) were the same (Ka =
  = 105). The theoretical curves for the quaternary complex (a, c, e, and g) were generated using eqs. 31 and 32 under Appendix with the ratio of G1/R = G2/R = 10 except in e, where G2/R = 0 and in g where G1/R = 0. The theoretical concentration response curves for the agonists in panels b, d, f, and h were generated from the operational model (percentage response = (100 × Sm)/(Sm + KE); KE = 0.03; m = 2) with the value for quaternary complex in a, c, e, and g substituted in for the stimulus (S), respectively. The values of the other microscopic constants in eqs. 31 and 32 were as follows: Ke = 7 × 10⁻³, Kf = 7 × 10⁻³, Kg = 7 × 10², Kh = 7 × 10², Ki = 7 × 10², Kj = 7 × 10², Kk = 1 × 10⁸, Kl = 1 × 10⁸, Km = 4 × 10⁴, Kn = 8 × 10², Ko = 8 × 10², Kp = 4 × 10⁴, Kq = 8 × 10⁻⁶, and Kr = 8 × 10⁻⁶. The concentration of GTP (X) was 1 mM.
Biological Data
In this section, we show that the product of observed affinity and intrinsic efficacy of an agonist, estimated by Furchgott's method of partial receptor inactivation, is equivalent to the RAi value estimated from the agonist concentration-response curve. These studies investigated the human M2 receptor expressed in CHO cells and the mouse M3 receptor in the ileum from M2 muscarinic receptor KO mice.
CHO-M2 Cells. CHO hM2 cells were used as a model system for studying the activity of muscarinic agonists at the human M2 muscarinic receptor. All of the agonists tested elicited a concentration-dependent inhibition of forskolin-stimulated cAMP accumulation (Fig. 6a). The average maximal inhibition ± S.E.M. caused by carbachol was 64.6 ± 1.2% of the stimulation elicited by forskolin (10 μM). Most of the agonists tested behaved as full agonists and elicited maximal responses ranging from 95.1 to 107.9% that of carbachol. Oxotremorine-M and oxotremorine were the most potent followed by carbachol, (S)-aceclidine, arecoline, pilocarpine, bethanechol, and McN-A-343. Pilocarpine and McN-A-343 behaved as partial agonists (Emax values, 70.6 ± 2.5 and 36.7 ± 2.7% of that of carbachol, respectively). The EC50 and Emax values of the agonists are listed in Table 2. The Hill slope of pilocarpine seemed unusually steep. We have no explanation for this behavior and assume that it is due to experimental error.
Agonist activity in CHO-M2 cells
The parameter estimates were calculated from data shown in Fig. 6. The data represents the mean values ± S.E.M. The mean values for carbachol were estimated from a total of 29 control values and 6 values measured after 4-DAMP mustard treatment from which the Furchgott analysis was performed. The number of experiments for the other agonists was three to five for the various conditions. The maximal responses are normalized relative to that of carbachol. Log means ± S.E.M. values are given in parentheses.

Muscarinic agonist mediated inhibition of forskolin-stimulated cAMP accumulation in CHO hM2 cells. a, concentration-response curves of selected muscarinic agonists for inhibiting the stimulation in cAMP accumulation elicited by forskolin (10 μM) in CHO hM2 cells. The data represent the mean values ± S.E.M. of 29 experiments for carbachol and 3 to 5 experiments for the other agonists. b, examples of the effect of 4-DAMP mustard-treatment (40 nM, 20 min) on carbachol- and oxotremorine-M-mediated inhibition of forskolin-stimulated cAMP accumulation. Mean values ± S.E.M. from five to six experiments are shown. The cells were washed after 4-DAMP mustard treatment and before measurement of the cAMP response to the agonists. c, relationship between equiactive agonist concentrations before and after 4-DAMP mustard treatment. d, the normalized response of selected agonists is plotted against receptor occupancy. The shared estimates ± S.E.M. of Msys and m for this plot are 109 ± 5.7 and 0.96 ± 0.11, respectively.
To estimate the observed dissociation constants of the agonists, we used a variant of Furchgott analysis (Ehlert, 1987) to examine the relationship between equivalent tissue response before and after partial receptor inactivation with the irreversible muscarinic antagonist 4-DAMP mustard. Figure 6b shows an example of the effect of 4-DAMP mustard treatment on responses elicited by carbachol and oxotremorine. Incubation of CHO hM2 cells with 4-DAMP mustard (40 nM) for 20 min followed by washing caused an increase in the EC50 and a decrease in the Emax values of all of the agonists except pilocarpine and McN-A-343 (Table 2). The responses to the latter agonists were completely inhibited by 4-DAMP mustard treatment. To determine the affinities of the full agonists, we interpolated agonist concentrations on the control concentration-response curve corresponding to equivalent responses on the curve measured after 4-DAMP mustard treatment. The average equiactive agonist concentrations are plotted in Fig. 6c for all of the full agonists. Regression analysis was used to fit eq. 3 to the corresponding data from each experiments to yield an estimate of the dissociation constant of the agonist and that of the residual proportion of receptors not inactivated by 4-DAMP mustard (q). The average values of these estimates for each agonist are listed in Table 2. The effectiveness of 4-DAMP mustard in inactivating the response varied in different experiments with the different agonists as manifest as variation in the q values. We assume that this variation is due to experimental error and variation in the concentration of the aziridinium ion of 4-DAMP mustard in each experiment on a different agonist. The dissociation constants of the partial agonists pilocarpine and McN-A-343 were estimated through simultaneous analysis of their data with those of carbachol using RAi analysis described under Materials and Methods. Knowing the affinities of the muscarinic agonists, it is possible to estimate receptor occupancy and, hence, to establish the relationship between occupancy and response as shown in Fig. 6d for all of the agonists. The efficacy of each agonist expressed relative to that of carbachol was estimated from this type of plot using nonlinear regression analysis (eq. 4) followed by substitution of the corresponding τ values into eq. 5 (Table 2). Regression analysis was done for each agonist using its own control occupancy-response relationship for carbachol. The estimates of m and Msys, expressed as the percentage of inhibition of forskolin-stimulated cAMP accumulation, did not differ significantly among the agonists, and the average estimates ± S.E.M. were Msys, 69.6 ± 4.1%, and m, 0.98 ± 0.06.
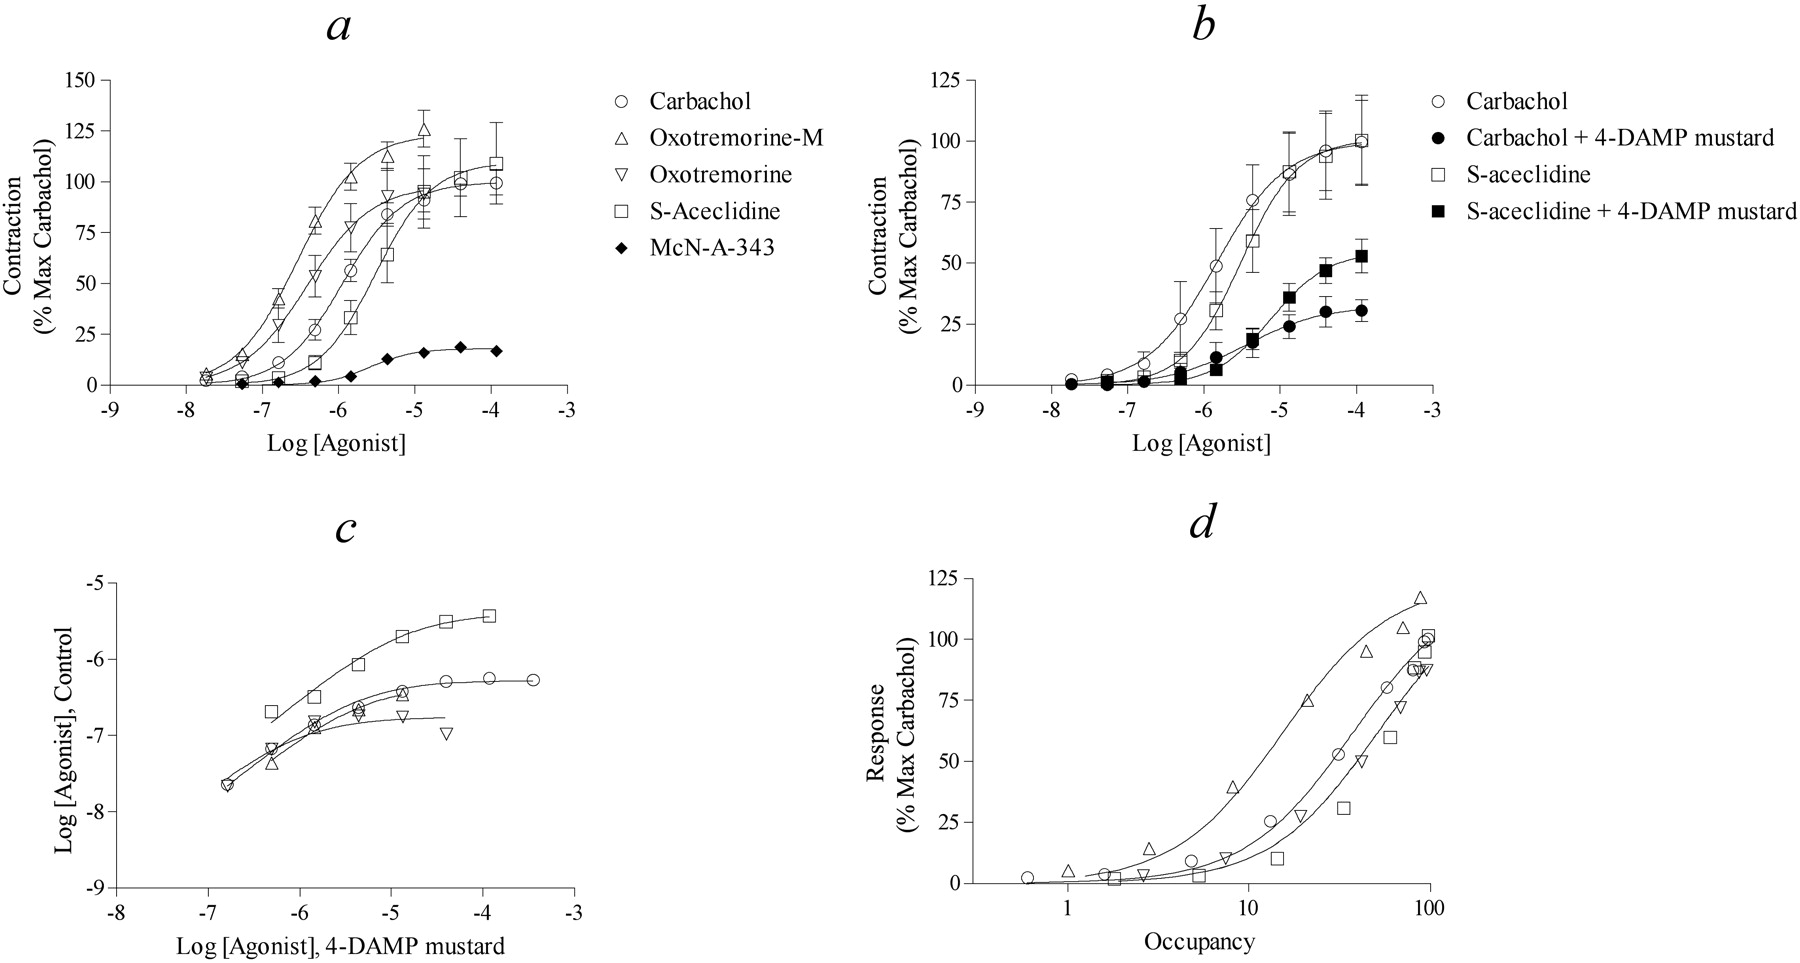
Isolated Ileum. The isolated ileum from M2 KO mice was used as an assay system for M3 muscarinic receptor activity. It is well known that the M3 receptor elicits a direct contractile response in the ileum from rodents (Eglen, 1997; Ehlert et al., 1997a). This tissue also contains an abundance of M2 receptors, which mediate contractile responses contingent upon activation of other receptors, including the M3 (Ehlert, 2003). To avoid a possible contribution of the M2 receptor, we measured contractile activity in ileum from M2 KO mice (Fig. 7a). The data from each experiment were first normalized relative to the contractile response elicited by 50 mM KCl. The average ± S.E.M. for the Emax of carbachol was 205.6 ± 7.1% relative to the KCl response. The data were normalized further by expressing the contractile response relative to the Emax of carbachol. A summary of the data can be found in Table 3, which lists EC50, Emax, and Hill slopes. Carbachol, oxotremorine-M, oxotremorine, and (S)-aceclidine behaved as full agonists (Emax values, 98.4-123% that of carbachol) whereas McN-A-343 behaved as a partial agonist (Emax value, 17.9 ± 1.4% that of carbachol).
Agonist activity in the M2 KO ileum
Parameter estimates were calculated from data shown in Fig. 7. Mean values ± S.E.M. are shown. The mean values for carbachol were estimated from a total of 22 control values and 12 values measured after 4-DAMP mustard treatment from which the Furchgott analysis was performed. The number of replicates for the other agonists was from six to seven for the various conditions. The maximal responses are normalized to that of carbachol. Log mean values ± S.E.M. are shown in parentheses.
To estimate the observed affinity constants of the agonists, we used the method of partial receptor inactivation as described above. Figure 7b shows an example of the effect of 4-DAMP mustard treatment (10 nM) on responses elicited by carbachol and (S)-aceclidine after incubation with the mustard for 40 and 20 min, respectively. Treatment with 4-DAMP mustard caused an increase in the EC50 and a decrease in the Emax values of all agonists except for McN-A-343 (Table 3), whose responses were completely eliminated by 4-DAMP mustard. Equiactive agonist concentrations before and after 4-DAMP mustard treatment were estimated for each agonist as described above, and the average values are plotted in Fig. 7c. Equation 3 was fitted to the corresponding data from each experiment using nonlinear regression analysis to yield estimates of the affinity constant of the agonist and the residual fraction of receptors (q). The average values for each agonist are listed in Table 3. The affinity of McN-A-343 was estimated through simultaneous analysis of its data together with those of carbachol using the RAi analysis as described above. Knowing the affinities of the muscarinic agonists, it is possible to plot the response against receptor occupancy (Fig. 7d). The efficacies of all the agonists relative to that of carbachol were estimated from this type of plot using eqs. 4 and 5 as described above (Table 3).

Contractile activity of muscarinic agonists in the isolated ileum from the M2 KO mouse. a, concentration-response curves of selected muscarinic agonists for eliciting contraction in the ileum are shown. The data represent the mean values ± S.E.M. of 22, 13, 7, and 6 experiments for carbachol, oxotremorine-M, oxotremorine, and (S)-aceclidine. b, the effect of 4-DAMP mustard on carbachol- and (S)-aceclidine-stimulated contractions. The ileum was incubated with 4-DAMP mustard (10 nM) for either 40 or 20 min, respectively, depending on whether carbachol or (S)-aceclidine was used as the agonist. The ileum was washed after treatment with 4-DAMP mustard and before measurement of the contractile responses to the agonists. Mean values ± S.E.M. from five to six experiments are shown. c, relationship between equiactive agonist concentrations before and after 4-DAMP mustard treatment. d, the normalized response of selected agonists is plotted against receptor occupancy.
In most instances, the EC50 values of the agonists after 4-DAMP mustard treatment were larger than the corresponding observed dissociation constants. This behavior is consistent with the existence of a threshold for contraction in the ileum (Furchgott, 1966). Knowing the relative efficacy of McN-A-343 (0.089) and that 4-DAMP mustard treatment (10 nM, 20 min; q = 0.46) eliminated the response to McN-A-343, we estimate the minimum value of this threshold to be approximately 4% of the maximal stimulus elicited to carbachol.
Comparison of RAi with the Product of Affinity and Efficacy. As explained previously, it is possible to estimate the product of the affinity and efficacy of an agonist expressed relative to that of a standard agonist, simply through the analysis of their respective concentration-response curves (Ehlert et al., 1999; Griffin et al., 2007). This estimate is known as intrinsic relative activity (RAi). We estimated the RAi values of agonists from the control concentration-response curves measured in CHO hM2 cells and in the ileum from M2 KO mice. We used two different methods for estimation of RAi. The first is a null method, which lacks any assumption about the relationship between the stimulus and response, and the second is based on a logistic relationship between stimulus and response (operational model; Black and Leff, 1983). Because all of the concentration-response curves resembled symmetrical logistic functions, the condition for the use of the operational model seems to have been met, and we would expect little difference in the estimates of RAi using both methods. The RAi values of all of the agonists were estimated using the two methods, and these are listed in Tables 4 and 5 for M2 and M3 assays, respectively.
Comparison between RAi values of agonists and the relative product of affinity and efficacy in CHO M2 cells
Log mean values ± S.E.M. from three to five experiments are shown in parentheses.
Comparison between RAi values of agonists and the relative product of affinity and efficacy in M2 KO ileum
Log mean values ± S.E.M. from six to seven experiments are shown in parentheses.
A relative estimate of the product of affinity and efficacy was calculated for each agonist. This was done by multiplying the affinity constant of each agonist by its relative efficacy and dividing this product by the corresponding product for carbachol. These estimates are listed in Tables 4 (M2 assay, i.e., CHO hM2) and 5 (M3 assay, i.e., ileum). Figure 8a shows a histogram of data from the CHO hM2 assay, comparing the RAi estimate of each agonist with its relative estimate of the product of affinity and efficacy. Two estimates of RAi are shown for each agonist, corresponding to the two methods of estimation. There is general agreement between the two estimates of RAi for each agonist, both of which are approximately equal to the estimate of the product of affinity and efficacy. We did not include the product of affinity and efficacy for pilocarpine and McN-A-343 in Fig. 8 because these estimates were made through analysis of the same data used to estimate RAi. It can be shown that the regression equations used to estimate the affinity of partial agonists are degenerate forms of those used to estimate the RAi of partial agonists. The agreement between RAi and the product of affinity and efficacy for pilocarpine and McN-A343 shown in Tables 4 and 5, therefore, is trivial. Rather, Fig. 8 illustrates that when the RAi is calculated from a concentration-response curve, the estimate is similar to the product of affinity and efficacy calculated from a different set of data consisting of responses measured before and after partial receptor inactivation.
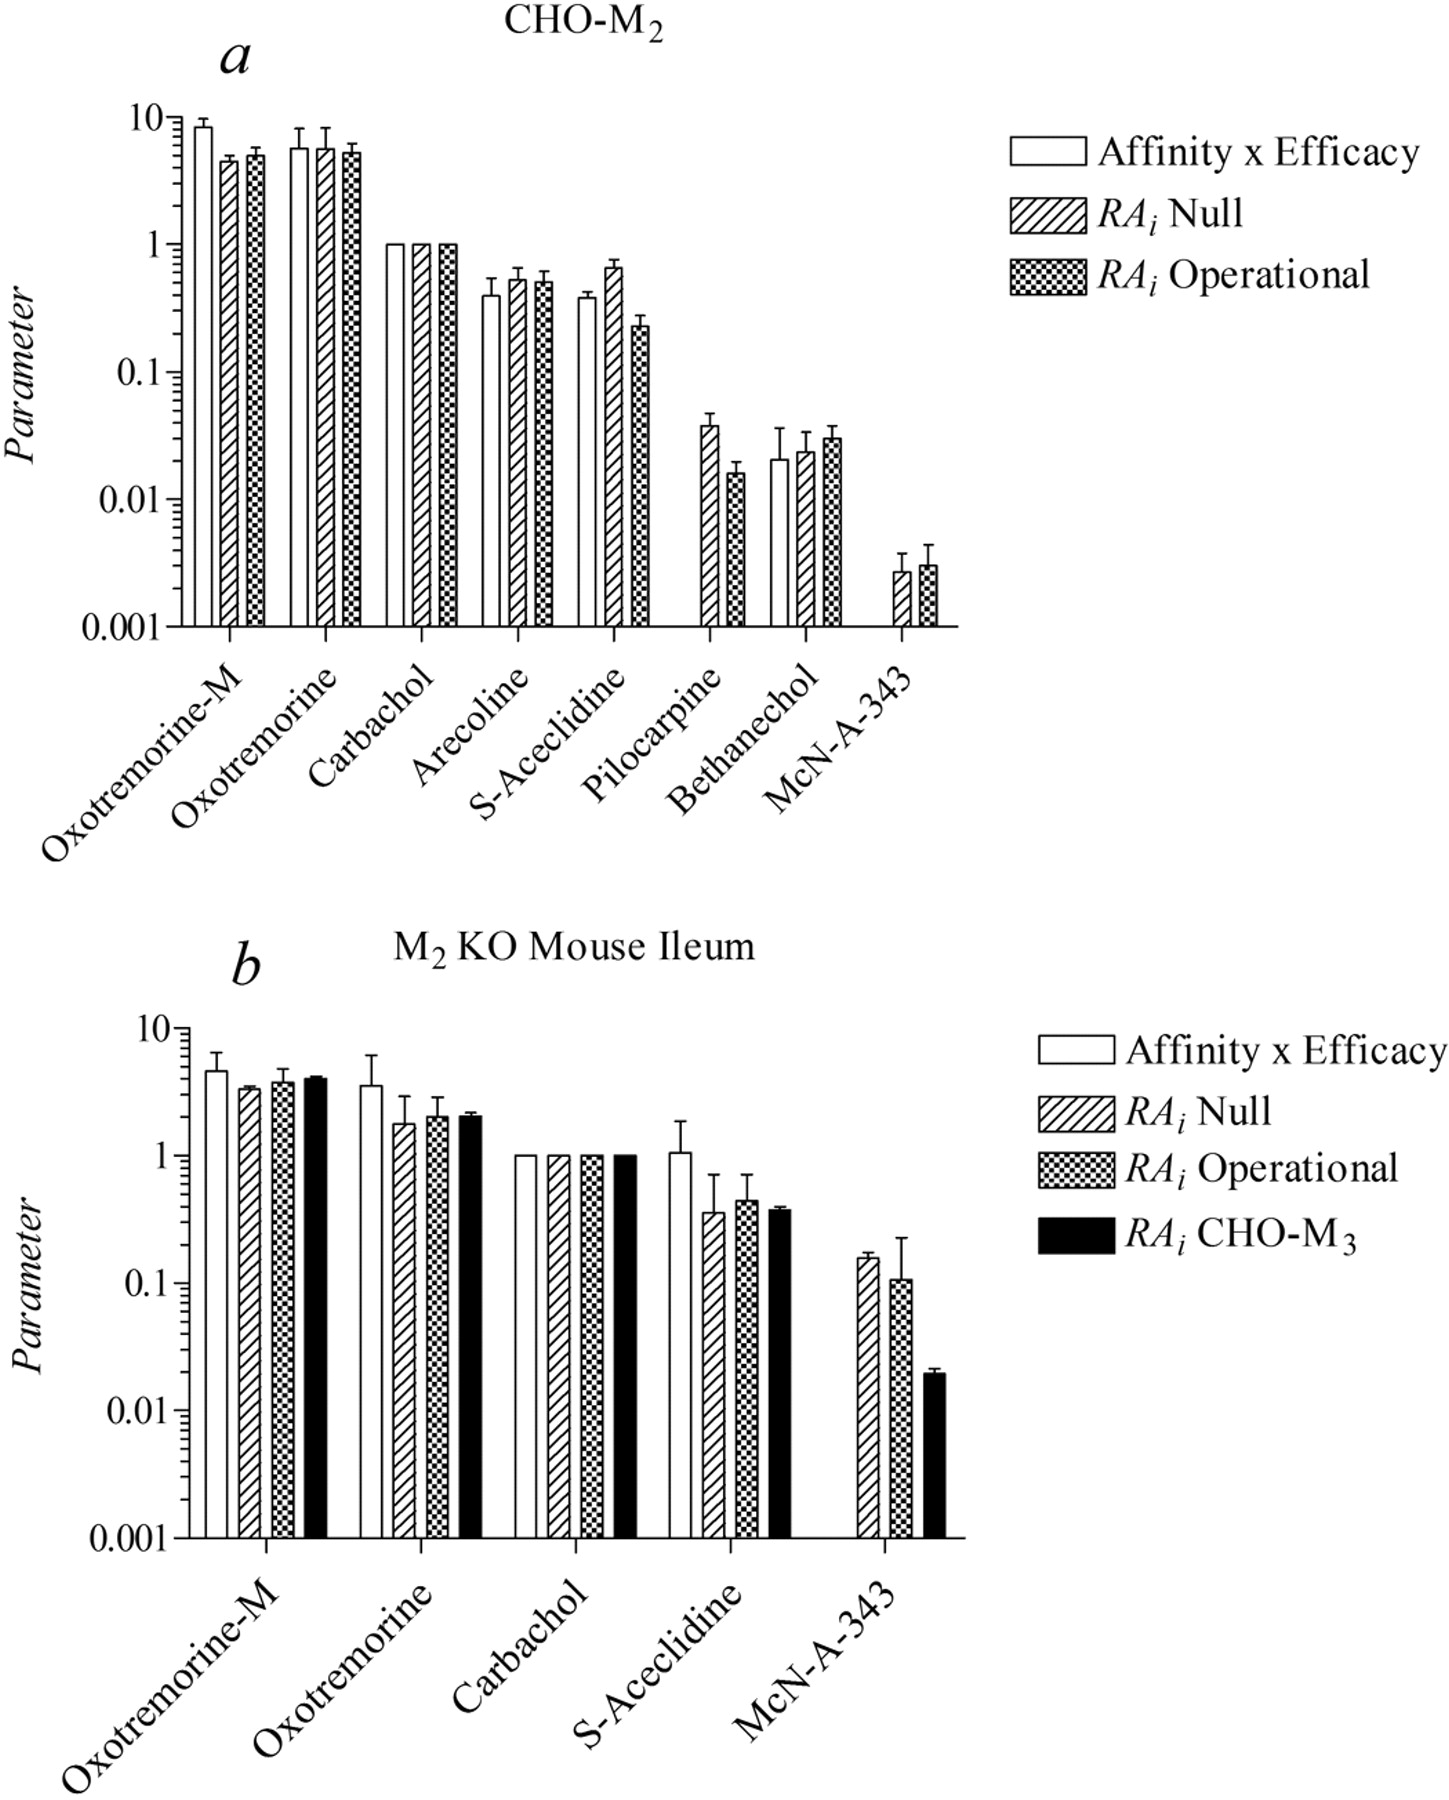
Comparison between RAi and the product of affinity and efficacy expressed relative to carbachol in CHO hM2 cells (a) and the ileum from the M2 KO mouse (b). b also shows the RAi estimates determined on the CHO hM3 cell as described previously (Ehlert et al., 1999).
We also compared the RAi estimates of the muscarinic agonists in the mouse M2 KO ileum (M3 assay) with those estimated previously in studies on the phosphoinositide response in CHO cells transfected with the hM3 receptor (Fig. 8b). There is general agreement among all of the estimates of RAi for each agonist with the exception of McN-A-343, whose RAi is substantially greater in the mouse ileum compared with that of the CHO hM3 cell (Ehlert et al., 1999). These data suggest that at least part of the response to McN-A-343 in the mouse ileum is mediated through a muscarinic receptor distinct from the M3. Evidence presented in the Supplemental Data support this hypothesis.
Discussion
Our overall hypothesis is that it is possible to calculate a relative estimate of the product of observed affinity and intrinsic efficacy of an agonist simply through the analysis of its concentration-response curve and that this estimate is a relative measure of the microscopic affinity constant of the agonist for the active state of the receptor. When calculated in CHO hM2 cells by the method of partial receptor inactivation, our estimates of the observed affinity constants of the agonists oxotremorine and oxotremorine-M were moderately higher (pKobs values: 6.54 and 6.15, respectively) than those estimated previously on homogenates of the rabbit myocardium (5.66 and 5.12) in the presence of GTP (0.1 mM) (Ehlert, 1987). The mammalian myocardium is known to express an abundance of M2 muscarinic receptors (Waelbroeck et al., 1986). Increasing the concentration of GTP reduces the observed affinity of agonists at the M2 receptor and increases the maximal amount of GDP-GTP exchange at Gi, which should increase agonist efficacy (Ehlert and Rathbun, 1990). Perhaps the higher affinity observed here may indicate that the concentration of GTP in the cytosol of CHO cells is lower than 0.1 mM. When the concentration of GTP is lower, it is easier for the agonist to induce the active conformation of the receptor, and under such conditions, the most efficacious agonists achieve maximal receptor activation. This condition may have been met in the present study because the relative efficacy values of arecoline, carbachol, oxotremorine-M, and oxotremorine seem to vary randomly around the value of the highly efficacious standard, carbachol (relative efficacy = 1; see Table 2). In the rabbit myocardium, however, the agonists exhibited the following rank order for relative efficacy: oxotremorine-M (3.6) > carbachol (2.3) > oxotremorine (1.2) (Ehlert, 1985). Because GTP has opposite effects on observed affinity and intrinsic efficacy (Ehlert and Rathbun, 1990), a variation in the concentration of GTP should have little effect on the product of these two parameters and, hence, on the estimate of RAi.
The estimates of the dissociation constants and relative efficacies of carbachol, oxotremorine, and oxotremorine-M in the M2 KO mouse are similar to those estimated in the isolated guinea pig ileum (Ringdahl and Jenden, 1983; Ringdahl, 1984, 1985). In addition, the RAi values of muscarinic agonists are consistent with those measured in the CHO hM3 cell, except for McN-A-343. Our results with pirenzepine and tetrodotoxin indicate that the response to McN-A-343 includes activation of another muscarinic receptor subtype.
In our studies on CHO M2 cells and the mouse ileum, we estimated the RAi values from the control concentration-response curve and from the individual parameters of observed affinity and relative efficacy using Furchgott analysis of the control data and that obtained after partial receptor inactivation. We found that the product of observed affinity and intrinsic efficacy was similar to the RAi estimate as predicted by theory. From the perspective of validating the RAi estimate, this approach may seem like a tautology because the model has only two degrees of freedom. If RAi (i.e., the product) and the observed affinity constant (i.e., a factor) are calculated first, and the relative efficacy is estimated using the control concentration-response curve together with receptor occupancy based on observed affinity, then there is a natural tendency for the estimate of relative efficacy to equal the RAi value divided by observed affinity, and hence, for the product of observed affinity and efficacy to equal the estimate of RAi. The basis for this tautology, however, rests on the assumption that the theory on which the RAi is based is valid in the first place. Our other reasons for estimating the observed affinities and intrinsic efficacies were to determine the individual components of the RAi estimate for the specific agonists tested and the extent to which a practical application of the two methods yielded similar results. We found reasonable agreement between the two approaches.
In comparing the contractile activity of muscarinic agonists in the ileum from the mouse and guinea pig, it is important to note that the guinea pig ileum is much more sensitive. For example, the potency of oxotremorine in the guinea pig ileum (Ringdahl, 1985; pEC50, 7.87) is approximately 30-fold greater than that measured in the mouse M2 KO ileum (pEC50, 6.41; see Table 4). This large difference cannot be attributed to the lack of the M2 receptor in the M2 KO mouse because there is little difference in the activity of carbachol in wild-type and M2 KO mouse ileum (Matsui et al., 2002). In contrast, the potencies and relative Emax values of McN-A-343 in the mouse M2 KO and guinea pig ilea are approximately the same (compare this study with Ehlert et al., 1999). Thus, the M3 contractile response of the mouse ileum is very insensitive, which explains perhaps why an M1 contractile mechanism for McN-A-343 is unmasked in this tissue (see Supplementary Data). The nature of the putative M1 response and its interaction with the M3 response is unclear, and it is impossible to estimate the relative contribution of a putative M1 component to the contractile response accurately from our antagonism studies with pirenzepine. It has been shown previously that the competitive inhibition of a response mediated by more than one receptor is complex, and the extent of the antagonism depends on the nature of the interaction between the two receptors (Ehlert, 2003). Nevertheless, our analysis indicates that pirenzepine causes a greater antagonism of the response to McN-A343 relative to that of carbachol in the M2 KO mouse ileum (Supplementary Data). In addition, it seems that part of the response to McN-A-343 is neurogenic, as indicated by the small inhibitory effect of tetrodotoxin (Supplementary Data). It would seem, therefore, that our RAi estimate for McN-A-343 is not representative of a pure M3 response but rather of a mixed response.
We also show that the estimate of RAi is equivalent to the microscopic affinity constant of an agonist for the active state of the receptor expressed relative to that of the standard agonist (Table 5). For a G protein-coupled receptor, the active state exhibits selectivity for G proteins or other coupling proteins (e.g., G protein-coupled receptor kinase), and in some instances, it seems that agonists may select unique conformations that recruit different G proteins, resulting in the phenomenon of ligand-directed signaling (Urban et al., 2007). Our mathematical modeling shows that the RAi estimate accurately reflects the microscopic affinity constant of the agonist for the active state of the receptor under these conditions. Leff et al. (1997) originally proposed a model for ligand-directed signaling, based on two different active conformations of the receptor that interact with two different G proteins. If an agonist exhibits a preference for one active state, it will tend to direct signaling through the corresponding G protein. Leff et al. (1997) showed that the stimulus function for a given pathway differs depending on whether the receptor is in a dynamic equilibrium with both G proteins at the same time or whether the two different receptor-G protein signaling pathways are segregated in different cells. In the former case, an agonist that preferentially directs signaling through one pathway would exhibit the same observed affinity for the two pathways but a difference in intrinsic efficacy, whereas in the latter case, the same agonist would exhibit differences in both observed affinity and intrinsic efficacy. We show that the estimate of RAi is unaffected by segregation or dynamic equilibrium, and in both cases, it accurately reflects a relative estimate of the microscopic affinity constant of the corresponding active state.
The phenomenon of ligand-directed signaling has led some to conclude that the transduction pathway can determine the activity of the agonist (Urban et al., 2007). Of course, the nature of the stimulus and concentration-response curve elicited by a specific agonist-receptor complex can change under conditions of ligand-directed signaling. Likewise, the RAi estimate for an agonist that directs signaling can change at the same receptor depending on the G protein that mediates the response. Under this condition, however, it is important to note that the RAi estimate accurately reflects the microscopic affinity constant of the agonist for the active receptor conformation eliciting the response, and hence, it is entirely receptor-dependent. Thus, rather than modifying signaling, G proteins simply provide a window for estimating the affinity constants of agonists for different effector-selective, active conformations. When viewed from this perspective, the phenomenon of ligand-directed signaling is determined by the agonist-receptor complex yet is manifest through different coupling proteins.
Appendix
RAi and the Microscopic Affinity Constant of the Active State of the Receptor. The first part of this Appendix describes the derivation of RAi in terms of the microscopic affinity constant of the agonist for the active state of the receptor. In this analysis, we consider the case of ligand-directed signaling, where there are two distinct active receptor states (R* and R**) that trigger responses through different G proteins. The model is shown schematically in Fig. 2. The parameter Ka denotes the microscopic affinity constant of agonist A for the ground state of the receptor (R), and Kb and Kc denote the microscopic affinity constants of the two active states. These affinity constants are defined in inverse molarity units (e.g., Ka = [AR]/[A][R]). Kq and Kr define the equilibrium between the free forms of the receptor (Kq = [R*]/[R] and Kr = [R**]/[R]).
We begin by deriving an equation expressing the fraction of occupied receptor in the active state (R*) as a function of the agonist concentration. This function is equivalent to the stimulus as defined by Furchgott (1966). Its maximum is equivalent to intrinsic efficacy (ϵ), and the concentration of agonist eliciting half-maximal formation of the active state is equivalent to the observed dissociation constant (Kobs). Then we solve the function for ϵ and Kobs, and substitute these functions into eq. 7, which defines RAi in terms of observed affinity and intrinsic efficacy. We repeat this process for the other active state (R**), as well as for the simple situation when there is only one active state.
The fractional amount of agonist-receptor complex in the active state R* is defined as  in which RT denotes the total receptor population. Using the definitions of the microscopic affinity constants, it is possible to replace each agonist-receptor complex on the right side of the equation with an expression in terms of A, R, and microscopic affinity constants. For example AR* = AKbKqR. Making these substitutions yields
  Simplifying yields
This equation can be arranged in the following form, which is equivalent to Furchgott's definition of the stimulus (Furchgott, 1966):
The variables stimulus1, ϵ1, and Kobs-1 denote the stimulus, observed intrinsic efficacy, and observed dissociation constant of the agonist for triggering a response through R*, respectively.
Substituting in eqs. 16 and 15 for the observed affinity (Kobs-1) and intrinsic efficacy (ϵ1) of the test agonist and standard agonist into eq. 7 under Materials and Methods yields an equation expressing RAi in terms of the microscopic affinity constants of the various receptor states:
In this equation, the microscopic constants of the test agonist are denoted in the normal manner (Ka, Kb, and Kc), whereas those of the standard agonist are denoted with an apostrophe ( ,
,  , and
, and  ). This equation simplifies to
  This equation shows that RAi value of an agonist for eliciting a response through the R* state of the receptor (RAi-1) is simply equivalent to the ratio of the microscopic affinity constant of the test agonist for the active state of the receptor (R*) divided by that of the standard agonist.
Using an analogous strategy for the R** state, it can be shown that the fractional amount of agonist bound in the AR** is given by
in which
In eqs. 20 to 22, stimulus2, ϵ2, and Kobs-2 denote the stimulus, observed intrinsic efficacy, and observed dissociation constant of the agonist for triggering a response through R**, respectively. The foregoing equations for the observed affinity (Kobs-2) and intrinsic efficacy (ϵ2) are substituted into eq. 7 under Materials and Methods to yield an equation expressing RAi in terms of the microscopic affinity constants of the various receptor states:
in which Ka, Kb, and Kc denote the microscopic constant of the test agonist, and  ,
,  , and
, and  denote those of the standard agonist. This equation reduces to
  This relationship between RAi and the microscopic affinity constants of the agonist for the active state of the receptor can also be shown to apply in the simple case where there is only one active conformation of the receptor (R*). In this situation, the amount of agonist-receptor complex in the active state is given by
  This equation can be rearranged into the following form to define the stimulus
  in which
 Substituting these equations for ϵ and Kobs in to eq. 7 yields an equation for the RAi value in terms of the microscopic constants of the test agonist (Ka, Kb) and standard agonist (
 ,
,  ):
):

In summary, eqs. 18, 24, and 30 demonstrate that the RAi estimate of an agonist is equivalent to its microscopic affinity constant for the active state of the receptor divided by that of the standard agonist.
Simulation of Ligand-Directed Signaling. Here we list the equations used to simulate the stimulus functions illustrated in Fig. 5 (i.e., eqs. 31 and 32). The model is shown schematically in Fig. 4, which represents a receptor in equilibrium with two G proteins in the presence of GTP. The derivation of these mathematics has been described previously (Ehlert, 2008), and the relevant equations for generating the plots of the quaternary complex against the agonist concentration are listed below for convenience. In these equations, Ka, Kb, Kc, Kq, and Kr are defined as described above. The equations describing the amount agonist (A) bound in the form of the two quaternary complexes (AR*G1X and AR**G2X), consisting of agonist, the active state of the receptor (R* and R**), G protein (G1 and G2), and guanine nucleotide (X) are
and RT denotes the total amount of receptor and G1T and G2T denote the total amount of G1 and G2 in the membrane. The cooperativity constants and microscopic constants for the different receptor complexes are defined as
The microscopic constants describing the equilibrium between the various states of the receptor, the two G proteins (G1 and G2) and guanine nucleotide (X) are 


Footnotes
-
This work was supported by the National Institutes of Health [Grant GM 69829].
-
ABBREVIATIONS: GPCR, G protein-coupled receptor; RAi, intrinsic relative activity; 4-DAMP mustard, N-(2-chloroethyl)-4-piperidinyldiphenyl acetate; CHO, Chinese hamster ovary; McN-A-343, 4-(m-chlorophenyl-carbamoyloxy)-2-butynyltrimethylammonium; KO, knockout.
-
↵
 The online version of this article (available at http://molpharm.aspetjournals.org) contains supplemental material.
 - Received August 11, 2008.
- Accepted November 6, 2008.

- The American Society for Pharmacology and Experimental Therapeutics


