


Abstract
Anthracyclines are effective genotoxic anticancer drugs for treating human malignancies; however, their clinical use is limited by tumor resistance and severe cardiotoxicity (e.g., congestive heart failure). Epirubicin (EPI) is less cardiotoxic compared with other canonical anthracyclines (e.g., doxorubicin). This has been attributed to its unique glucuronidation detoxification pathway. EPI is primarily inactivated by UDP-glucuronosyltransferase 2B7 (UGT2B7) in the liver. Hence, the regulation of hepatic UGT2B7 expression is critical for EPI systemic clearance but remains poorly characterized. We show herein that EPI upregulates UGT2B7 expression in hepatocellular carcinoma (HCC) HepG2 and Huh7 cells. Our analyses of deleted and mutated UGT2B7 promoter constructs identified a p53 response element (p53RE) in the UGT2B7 promoter. EPI stimulated UGT2B7 promoter activity via this p53RE and enhanced in vivo p53 binding at this p53RE in HepG2 cells. Knockdown of p53 expression by small interfering RNA silencing technology significantly repressed the capacity of EPI to stimulate UGT2B7 transcription. Furthermore, the p53 activator nutlin-3α significantly enhanced UGT2B7 expression and recruited the p53 protein to the UGT2B7 p53RE in HepG2 cells. Collectively, our results demonstrated that EPI promotes its own detoxification via the p53-mediated pathway. This regulation may contribute to tumor resistance to EPI-containing HCC chemotherapy and may also provide a new explanation for the reduced cardiotoxicity of EPI compared with other anthracyclines. Our finding also suggests that upon exposure to genotoxic agents, detoxifying genes are activated by the p53-mediated pathway to clear genotoxic agents locally within the tumor site or even systemically through the liver.
Introduction
Anthracyclines are among the most effective anticancer drugs. Doxorubicin (DOX), daunorubicin (DNR), epirubicin (EPI), and idarubicin (IDA) are classic anthracyclines, which share a typical quinone-containing tetracyclic aromatic ring structure with a sugar moiety, namely daunosamine, attached at the C-7 of ring A through a glycosidic bond (Ormrod et al., 1999). DNR was the first anthracycline that was initially isolated from Streptomyces peuceticus cultures. Structural modification of the DNR led to DOX (hydroxylation at C-14) and IDA (demethoxylation at C-4). EPI is an epimer of DOX with the C′-4 hydroxyl group on the sugar being axial in DOX and equatorial in EPI (Ormrod et al., 1999). DNR and IDA are generally restricted to treatment of acute myeloid leukemias and acute myelogenous leukemia, respectively (Piekarski and Jelinska, 2013). In contrast, DOX and EPI have a broader spectrum of anticancer activities with similar equimolar efficacy for treating various solid tumors and hematologic malignancies (Minotti et al., 2004).
Chronic administration of anthracyclines induces irreversible cardiomyopathy that leads to congestive heart failure, and this limits their clinical use (Minotti et al., 2004). To avoid congestive heart failure, a maximum cumulative dose of ∼500 mg/m2 for anthracyclines (e.g., DOX) has been recommended for clinical use (Minotti et al., 2004). In contrast, EPI has a higher recommended maximum cumulative dose of ∼900 mg/m2. This allows more treatment cycles of EPI with no extra toxicity (Minotti et al., 2004). Anthracyclines are intensively metabolized in the liver. Classic anthracyclines can be converted to the less cytotoxic carbon-13 dihydroderivatives (e.g., doxorubicinol, epirubicinol, daunorubicinol, and idarubicinol) by aldoketoreductases (Jin and Penning, 2007) or carbonyl reductases (Bains et al., 2009). This represents the major metabolic pathway for DOX, DNR, and IDA (Le Bot et al., 1988). In contrast, with an equatorially positioned C′-4 hydroxyl group that permits glucuronidation, EPI can be converted to EPI-glucuronide. After administration, EPI-glucuronide is the major metabolite of EPI in plasma and bile (Minotti et al., 2004). EPI-glucuronide is not cardiotoxic and is rapidly excreted from the body (Ormrod et al., 1999). The reduced cardiotoxicity of EPI has been attributed to its unique glucuronidation clearance pathway (Ormrod et al., 1999).
Glucuronidation, which is carried out by UDP-glucuronosyltransferases (UGTs), has an important role in drug detoxification and clearance. Human UGTs are classified into subfamilies based on their amino acid sequence homology (Mackenzie et al., 1997, 2005). Glucuronidation of EPI is primarily carried out by UGT2B7 in the liver (Ormrod et al., 1999; Innocenti et al., 2001). As a result, factors that modulate hepatic UGT2B7 expression and activity would have potential impact on EPI systemic clearance. EPI is used to treat hepatocellular carcinoma (HCC) and a variety of nonhepatic human malignancies. In terms of intratumoral detoxification of EPI, upregulation of UGT2B7 in cancer cells by EPI would be clinically relevant. Furthermore, a possible upregulation of UGT2B7 by EPI in a cancerous or even normal hepatic cellular context would be more significant, because this would promote EPI systemic clearance when EPI is administered to patients with nonhepatic cancers (e.g., breast cancer). These hypotheses remain to be investigated.
The tumor suppressor p53 protein is well known for its role in suppressing carcinogenesis. This is partly because of its ability to activate a variety of genes that are involved in DNA repair and apoptosis in response to DNA damage. p53 is a transcription factor and regulates its target gene transcription by binding to p53 response elements (p53RE) that are present in target gene promoters and enhancers. A canonical p53RE contains two 10-base decamers RRRCWWGYYY that are separated by a spacer of 0–21 (R is a purine; Y is a pyrimidine; W is A or T) (Riley et al., 2008). Upon activation, p53 binds as a tetramer, with each p53 protein interacting with one pentamer of RRRCW or WGYYY at the site to activate or repress target gene transcription (Riley et al., 2008; Menendez et al., 2009).
In the present study, we reported that EPI stimulates the expression and activity of the UGT2B7 enzyme in HCC cell lines. We further demonstrated that in the HepG2 cell line, the most frequently used hepatic model cell line, EPI promotes UGT2B7 gene transcription via p53 binding to a p53RE in its proximal promoter. This study identifies UGT2B7 as a novel p53 target gene.
Materials and Methods
Epirubicin, nutlin-3α, cycloheximide, actinomycin D, morphine, and UDP-glucuronic acid were all purchased from Sigma-Aldrich (St. Louis, MO). Primers were synthesized by Sigma-Genosys (Castle Hill, NSW, Australia). Restriction endonucleases (KpnI, MulI, and XhoI) were purchased from New England Biolabs (Ipswich, MA).
Cell Treatment, RNA Extraction, and Reverse-Transcription Quantitative Real-Time Polymerase Chain Reaction.
The hepatocellular carcinoma HepG2 cell line was purchased from ATCC, and the Huh-7 cell line was obtained from Dr. Jillian Carr (Flinders University, Adelaide, SA, Australia). Both cell lines were maintained in Dulbecco’s modified Eagle’s medium (DMEM) containing 10% fetal bovine serum at 37°C in a 5% CO2 atmosphere. For drug treatment, cells were plated in 6-well plates and cultured for 3–4 days when they reached approximately 80% confluence. Cells were then treated with drugs in triplicate at concentrations and lengths of time as indicated in the figures. Total RNA was extracted using the RNeasy Mini Kit (Qiagen, Valencia, CA), and the resultant RNA was used to generate cDNA using Invitrogen reverse-transcription reagents as previously reported (Hu and Mackenzie, 2009). Real-time polymerase chain reaction (PCR) was performed using a RotorGene 3000 instrument (Corbett Research, Mortlake, NSW, Australia) in a 20-µl reaction of 1× QuantiTect SYBR Green PCR master mix (Qiagen) containing ∼60 ng of cDNA sample and a pair of gene-specific primers (500 nM for each primer). The primers and the methods used to quantify the transcript levels of UGTs, β-actin, and 18S rRNA were previously described (Congiu et al., 2002; Hu and Mackenzie, 2009, 2010; Hu et al., 2010). The mRNA levels of p21 and CYP3A4 relative to 18S rRNA were quantified using the 2−∆∆Ct method (Livak and Schmittgen, 2001). The PCR primers for p21 and CYP3A4 are given in Table 1.
Primers used in this study for qPCR, promoter cloning and mutagenesis, and ChIP-qPCR
Generation of UGT2B7 Promoter Luciferase Reporter Deletion Constructs and Mutants.
Eleven pGL3-derived luciferase reporter constructs carrying varying lengths of the UGT2B7 promoter were used in transient transfection in this study (Fig. 4). Four of these constructs were previously reported, namely 2B7-44/+59, 2B7-132/+59, 2B7-275/+59, and 2B7−516/+59 (Ishii et al., 2000; Gregory et al., 2006). Nucleotides of promoter constructs were numbered from the transcription start site in these studies. These constructs were renamed herein as 2B7-103/-1, 2B7-191/-1, 2B7-334/-1, and 2B7-575/-1 by numbering nucleotide +1 as the A of the initiation codon, as recommended by the Gene Nomenclature Committee. In the present study, two promoter fragments, −240/−1 and −283/−1 were amplified from the 2B7-575/-1 construct with Phusion hot start high-fidelity DNA polymerase (Thermo Fisher Scientific, Pittsburgh, PA) and cloned into the KpnI site of the pGL3-basic vector generating two constructs (2B7-240/-1 and 2B7-283/-1) (Fig. 4B). Five UGT2B7 promoter fragments (−1046/−1, −2076/−1, −3026/−1,−4026/−1, and −4926/−1) were further amplified from a commercial genomic DNA sample (Roche) and cloned into the MulI and XhoI sites of the pGL3-basic vector generating five reporter constructs (2B7-1046/-1, 2B7-2076/-1, 2B7-3026/-1, 2B7-4026/-1, and 2B7-4926/-1, respectively). Sequencing of the cloned promoter fragments showed that their sequences all matched the UGT2B7 promoter reference sequence (NC-000004.11). As depicted in Fig. 4C, the 51-bp promoter region between nucleotides −288 and −238 in the 2B7-575/-1 reporter construct was mutated at five positions using the QuikChange site-directed mutagenesis kit (Stratagene, La Jolla, CA) to generate five mutants (−575/−TM1–5). The sequences of primers for PCR, sequencing, cloning, and mutagenesis are given in Table 1.
Transient Transfection and Luciferase Reporter Assay.
Exponentially growing HepG2 cells were trypsinized and subsequently plated into 96-well plates in 100 µl of DMEM supplemented with 10% fetal bovine serum. Fifty microliters of transfection mixture containing 200 ng of each reporter construct, 8 ng of pRL-null vector (Promega, Madison, WI), and 0.8 µl of Lipofectamine 2000 (Invitrogen) were added to each well when the culture reached approximately 60% confluence. Twenty-four hours after transfection, the transfection medium was removed and cells were treated with 1 µM EPI or vehicle (0.1% ethanol) for 24 hours. Cells were then lysed for luciferase assays using the Dual-Luciferase Reporter Assay System (Promega) according to the manufacturer’s instructions as previously described (Hu and Mackenzie, 2009).
Small Interfering RNA Knockdown Experiments.
On-TARGETplusSMARTpool small interfering RNA (siRNA) against p53 and On-TARGETplus nontargeting pool siRNA (nontarget siRNA) were purchased from Dharmacon RNAi Technologies (Lafayette, CO). For transfection assays, 1.5 ml of fresh DMEM containing HepG2 cells (3 × 10⁵) was combined with 0.5 ml of serum-free DMEM medium containing 10 µl of Lipofectamine 2000 and 10 μl of anti-p53 siRNA (20 µM) or nontarget siRNA (20 µM) and subsequently plated into 6-well plates. Each transfection was conducted in four wells. Twenty-four hours after transfection, the medium was removed and cells were incubated for another 24 hours in fresh DMEM medium. Forty-eight hours post-transfection, cells were harvested from one well of each transfection for Western blotting assays as described below. The remaining three wells of each transfection were treated with 1 µM EPI or vehicle (0.1% ethanol) for 24 hours. Cells were then harvested for total RNA, followed by reverse-transcription quantitative real-time PCR to quantify target mRNA levels as described above.
Western Blotting.
Whole-cell lysates were prepared from EPI (or vehicle)-treated HepG2 cells or anti-p53 siRNA (or nontarget siRNA)-transfected HepG2 cells in RIPA buffer [50 mM Tris-HCl, pH 8.0, 1% Igepal CA-630 (NP-40), 150 mM sodium chloride, 0.5% sodium deoxycholate, and 0.1% sodium dodecyl sulfate]. Protein concentrations of the resultant whole-cell lysates were determined using the Bradford Protein Assay (Bio-Rad, Hercules, CA). Proteins (30 µg) were separated on SDS-polyacrylamide gels (10%) and transferred to nitrocellulose membranes for Western blotting. The anti-UGT2B7 antibody was developed in our laboratory as previously reported (Kerdpin et al., 2009; Hu et al., 2014). The anti-p53 antibody (FL-393) was purchased from Santa Cruz Biotechology (Dallas, TX). Membranes were incubated first with the primary antibodies and then with a horseradish peroxidase–conjugated donkey anti-rabbit secondary antibody (NeoMarkers). Immunosignals were detected with the SuperSignalWest Pico Chemiluminescent kit (Thermo Fisher Scientific) and an ImageQuant LAS 4000 luminescent image analyzer (GE Healthcare, Chalfont St. Giles, UK). Quantitation of band intensity and background subtraction was performed by Multi Gauge Ver3.0 (FujiFilm, Tokyo, Japan).
Morphine Glucuronidation Assay.
HepG2 cells were plated in T75 flasks and cultured until they reached 80% confluence. Cells were then treated with 1 µM EPI or vehicle (0.1% ethanol) for 24 hours. Cells were harvested, washed with 1× phosphate-buffered saline twice, and then lysed in 250 µl of TE buffer (10 mM Tris-HCl, 1 mM EDTA, pH 7.6) followed by protein concentration determination using the Bradford Protein Assay (Bio-Rad). For morphine glucuronidation assays, duplicate 200 µl reactions of each sample containing 100 mM potassium phosphate pH 7.5, 4 mM MgCl2, 5 mM morphine, 1 mg/ml lysate protein, and 5 mM UDP-glucuronic acid, were incubated at 37°C in a shaking water bath for 2 hours. Reactions were terminated by addition of 2 µl HClO4 (70%, v/v). The reaction was cooled on ice for 30 minutes and then centrifuged at 10°C at 6000g for 10 minutes. Ten microliters of supernatant fraction of each reaction was subjected to high-performance liquid chromatography analysis using an Agilent 1100 series instrument (Agilent Technologies, Sydney, NSW, Australia) as previously reported (Uchaipichat et al., 2011). In brief, retention times for morphine-3-glucuronide, morphine-6-glucuronide, and morphine were 7.0, 10.3, and 13.6 minutes, respectively. Concentrations of morphine-3-glucuronide and morphine-6-glucuronide in incubation samples were quantified by comparison of peak areas to those of standard curves prepared over the concentration ranges of 0.5 to 20 and 0.5 to 5 nM, respectively.
Chromatin Immunoprecipitation Assay and Quantitative Real-Time PCR.
Chromatin immunoprecipitation assay and quantitative real-time PCR (ChIP-qPCR) was performed as described previously (Hu and Mackenzie, 2009). Briefly, HepG2 cells were treated with 1 µM EPI, 10 µM nutlin-3α, or vehicle (0.1% ethanol) for 24 hours. Cells were then cross-linked by 1% formaldehyde, followed by quenching using 125 mM glycine solution. Cells were lysed, sonicated, and then subjected to immunoprecipitation with 8 µg of the p53 antibody (FL393; Santa Cruz Biotechnology) or equivalent amounts of the rabbit preimmune IgG control (sc-2027; Santa Cruz Biotechnology). The resultant chromatin precipitates were captured by Protein A Sepharose CL-4B beads (GE Healthcare) and subsequently eluted from the beads in different buffers as described previously (Hu and Mackenzie, 2009). Cross-linking was reversed by heating the eluates at 65°C overnight. The resulting DNA/protein precipitates were digested with proteinase K, followed by phenol-chloroform extraction and ethanol precipitation. The DNA pellets were resuspended in 50 µl of Tris-EDTA buffer. By use of 2 µl of each of the resultant DNA samples as template, real-time qPCR was performed to quantify the UGT2B7 promoter region containing the putative p53RE or the CYP3A4 promoter region containing a recently reported p53RE as a positive control (Goldstein et al., 2013). As illustrated in Fig. 7A, two promoter regions upstream the UGT2B7 p53RE were also quantified by qPCR. Data from region 1 served as a negative control, whereas data from region 2 were used to normalize the starting amounts of immunoprecipitated DNA added to each PCR. The p53 binding at the two p53REs and the negative control region 1 relative to the control region 2 were quantified using the 2−∆∆Ct method (Livak and Schmittgen, 2001). qPCR primers are given in Table 1.
Statistical Analysis.
Statistical analysis was done with a two-tailed Student’s t test using Microsoft Excel 2010 (Redmond, WA). A P value less than 0.05 was considered statistically significant.
Results
Epirubicin Stimulates UGT2B7 mRNA Expression in a Dose- and Time-Dependent Manner in Hepatocellular Carcinoma Cell Lines.
EPI is genotoxic and inhibits in vitro cell growth (Minotti et al., 2004). EPI concentrations ≤1 µM, which are within the EPI plasma and tissular concentration range observed in patients after EPI administration, were used in this study (Italia et al., 1983; Ormrod et al., 1999). To assess potential effects of EPI on UGT2B7 mRNA levels in a hepatic cellular context, we treated two hepatocellular carcinoma cell lines, HepG2 and Huh7, with 1 µM EPI for 24 hours. As shown in Fig. 1, EPI elevated UGT2B7 mRNA levels approximately 23- and 6-fold in HepG2 and Huh7 cells, respectively. In contrast, the mRNA levels of UGT2B10 and β-actin (a housekeeping gene) remained unchanged after EPI stimulation. These results indicate that EPI specifically elevated UGT2B7 mRNA levels in HCC cell lines.

Epirubicin elevates UGTB7 mRNA levels in hepatocellular carcinoma HepG2 and Huh7 cell lines. HepG2 or Huh7 cells were plated in 6-well plates and cultured for 2–3 days until they reached approximately 80% confluence. Cells were then treated in triplicate with 1 µM EPI or vehicle (0.1% ethanol) for 24 hours. Total RNA was extracted and reverse-transcribed to generate cDNA, followed by quantitative real-time PCR to quantify the mRNA levels of three genes (UGT2B7, UGT2B10, and β-actin) as described in Materials and Methods. Data are presented as fold-induction in target gene mRNA levels in EPI-treated cells over those (set as value of 1) in vehicle-treated cells. Data shown are means ± 1 S.D. from a representative experiment of three independent experiments performed in triplicate. *P < 0.05; **P < 0.01. ETH, ethanol.
Studies with the HepG2 cell line, the most frequently used human liver cell line, have contributed greatly to our understanding of hepatic drug metabolism and detoxification. Given our finding that EPI induced UGT2B7 expression in HepG2 cells nearly 4 times higher than that in Huh7 cells (Fig. 1), we focused our investigation on HepG2 cells to define the molecular mechanism(s) underlying EPI stimulation of UGT2B7 expression in a hepatic cellular context. First, we treated HepG2 cells with EPI at 1 µM or lower doses (100, 200, 300, 400, 500, or 800 nM) to define the minimum effective dose. As shown in Fig. 2A, EPI at 200 nM started to elevate UGT2B7 mRNA levels. This stimulation was gradually increased with increasing doses, and at 800 nM reached approximately 30% of that induced by 1 µM. Second, we treated HepG2 cells with 1 µM EPI for varying periods (2, 4, 6, 8, 12, or 24 hours) to define the minimum effective time. As shown in Fig. 2B, a 2-hour treatment started to increase UGT2B7 mRNA levels. This stimulation was increased as the length of treatment was extended and at 12 hours reached about 50% of the induction observed at 24 hours. Third, we treated HepG2 cells with 1 µM EPI in combination with cycloheximide (2 µM) or actinomycin D (2 µM) for 12 hours to determine whether EPI could act at the transcriptional and/or translational levels. As shown in Fig. 2C, the EPI-induced elevation of UGT2B7 mRNA levels was completely abrogated by the transcriptional inhibitor actinomycin D. This induction was not completely, but significantly, repressed by the translational inhibitor cycloheximide, suggesting the necessity for de novo protein synthesis. Taken together, our results indicate that EPI elevates UGT2B7 mRNA levels by stimulating its transcription in a dose- and time-dependent manner in HepG2 cells.

Epirubicin stimulates UGT2B7 transcription in a time- and dose-dependent manner in HepG2 cells. (A) HepG2 cells were treated with vehicle (0.1% ethanol) or various concentrations of EPI (100, 200, 300, 400, 500, 800, or 1000 nM) for 24 hours. (B) Cells were treated with 1 µM EPI for 2, 4, 6, 8, 12, or 24 hours. (C) HepG2 cells were treated with vehicle (0.1% ethanol), 2 µM actinomycin D (ATD), 2 µM cycloheximide (CHX), 1 µM EPI, or a combination of 1 µM EPI with 2 µM CHX or 2 µM ATD for 12 hours. After treatment, total RNA was extracted from cells and reverse-transcribed to generate cDNA, followed by quantitative real-time PCR to quantify the mRNA levels of UGT2B7 and UGT2B10 as described in Materials and Methods. Data presented as fold change of each target mRNA levels in cells that were treated as indicated compared with those (set as a value of 1) in vehicle-treated cells. Data shown are means ± 1 S.D. from a representative experiment of two independent experiments performed in triplicate. **P < 0.01. ETH, ethanol.
Epirubicin Increases UGT2B7 Protein and Enzymatic Activity.
After having demonstrated that EPI elevated UGT2B7 mRNA levels, we prepared whole-cell lysates from HepG2 cells treated with 1 µM EPI or vehicle (0.1% ethanol) for 24 hours and then performed Western blotting to see whether EPI could increase UGT2B7 protein levels. Quantitative analysis of the UGT2B7 immunosignals (Fig. 3A) confirmed exposure to 1 µM EPI for 24 hours induced UGT2B7 protein levels by 2.7-fold compared with vehicle control (Fig. 3B) (P < 0.05).

Epirubicin increases UGT2B7 protein levels and enzymatic activity in HepG2 cells. (A) Cells were treated with 1 µM EPI or vehicle (0.1% ethanol) for 24 hours in triplicate. After treatment, cells were harvested for preparing whole-cell lysate. Whole-cell lysates were also prepared from wild-type human embryonic kidney (HEK)293 cells that expressed no UGT2B7 proteins for a negative control or HEK293 cells that stably expressed UGT2B7 proteins for a positive control. Proteins (30 µg) of whole-cell lysates were subjected to Western blotting using an antibody against UGT2B7 (top) or β-actin (bottom) as described in Materials and Methods. (B) Shown is fold-induction of UGT2B7 protein levels in EPI-treated cells compared with that (set a value of 1) in vehicle-treated cells. (C) Morphine glucuronidation assays were performed using cell lysates from EPI-treated or vehicle-treated HepG2 cells as described in Materials and Methods. Shown are fold changes in the formation of morphine-3-glucuronide (morphine-3-G) or morphine-6-glucuronide (morphine-6-G) in EPI-treated cells compared with that (set as a value of 1) in vehicle-treated HepG2 cells. *P < 0.05; **P < 0.01.
UGT2B7 is the major UGT that conjugates morphine, generating two products: morphine-3-glucuronide and morphine-6-glucuronide (Coffman et al., 1997). We performed glucuronidation assays and subsequent high-performance liquid chromatography quantitative analyses to compare morphine-glucuronidating activity between EPI-treated and vehicle-treated HepG2 cells. As shown in Fig. 3C, compared with vehicle-treated cells, EPI-treated HepG2 cells had a significant increase of 5-fold (P < 0.01) and 8-fold (P < 0.01) in the formation of morphine-3-glucuronide and morphine-6-glucuronide, respectively. Altogether, these results indicate that EPI increases UGT2B7 protein and enzymatic activity levels in HepG2 cells.
Epirubicin Stimulates the UGT2B7 Promoter Activity via a Putative p53RE.
Having already shown that EPI elevates UGT2B7 mRNA levels through stimulating transcription, we went further to test whether EPI could stimulate UGT2B7 promoter activity in HepG2 cells. For this purpose, we transfected nine luciferase reporter constructs carrying varying lengths of the UGT2B7 promoter into HepG2 cells, followed by treatment with 1 µM EPI or vehicle (0.1% ethanol) for 24 hours. As shown in Fig. 4A, the activities of UGT2B7 promoters ≥334 bp in length were at least fivefold higher than those of promoters ≤191 bp in vehicle-treated HepG2 cells. EPI stimulation resulted in a significant increase of at least fourfold in the activity levels of promoters ≥334 bp in length; however, this induction was not observed with promoters ≤191 bp long. These results suggested that the 143-bp promoter region from nucleotides −191 to −334 harbors a regulatory cis-acting element(s), which is critical to both the basal activity of the UGT2B7 promoter and its response to EPI. To further define the EPI-responsive region, the promoter regions −1 to −240 bp and −1 to −283 bp were amplified from construct 2B7-575/-1 and subsequently cloned into the pGL3-basic vector generating constructs 2B7-240/-1 and 2B7-283/-1. As shown in Fig. 4B, EPI stimulated the activity of construct 2B7-283/-1 but had no impact on the activity of construct 2B7-240/-1. This suggested that the EPI-responsive element(s) resides within the 44-bp promoter region between nucleotides −240 and −283.

Deletion and mutagenesis analyses of the UGT27 promoter in HepG2 cells identify a p53RE that mediates epirubicin responsiveness. A series of deleted (A) and mutated (B) UGT2B7 promoter constructs were transfected into HepG2 cells. Briefly, cells were plated into 96-well plates and cultured until they reached 60% confluence. Cells were transfected in triplicate with 200 ng of each promoter construct, 8 ng of PRL-null vector, and 0.8 μl of Lipofectamine 2000. Twenty-four hours after transfection, transfection medium was removed and replaced with fresh medium. Forty-eight hours after transfection, cells were treated with 1 µM EPI or vehicle (0.1% ethanol) for 24 hours. After treatment, cells were harvested and assayed for firefly luciferase activity as described in Materials and Methods. After normalized to that of the promoterless pGL3-basic vector, data were presented as fold induction of the activities of promoter constructs in EPI-treated cells compared with that (set at a value of 1) in vehicle-treated cells. Data shown are means ± 1 S.D. from a representative experiment of three independent experiments performed in triplicate. (C) Five mutations at the UGT2B7 promoter between nucleotides −288 and −238 that mutated the p53RE (MT3 and MT4), FXR site (MT5), or sequences that are upstream of the p53RE (MT1 and MT2). Mutated sequences are boxed with the wild-type sequences underlined and the mutated sequences shown above the wild-type sequences. Both of the p53RE and FXR sites are underlined. Of note, there is 4-bp overlap between these two sites. TM, mutant.
As shown in Fig. 4C, bioinformatic analyses of this 44-bp sequence by the LASAGNA program identified a putative p53RE (5′-TGGCATGTCCATACAAGATC-3′, core sequences underlined) between nucleotides −251 and −270 (Lee and Huang, 2013). In addition, this 44-bp region also contains a farnesoid X receptor (FXR) binding site (5′-GATCCTTGATATTAG-3′) between nucleotides −239 and −254, which has been shown to be involved in repressing UGT2B7 expression by lithocholic acid in human colorectal adenocarcinoma cell line cells (Lu et al., 2005). Of interest, there is a 4-bp overlap between this FXR site and our predicted p53RE. The strongest p53REs, such as the p21 p53-RE2, usually have no spacer between two decamers (RRRCWWGYYY) (Saramaki et al., 2006; Riley et al., 2008). The CWWG core sequence in the form of CATG is associated with higher binding affinity compared with the three other possible sequences (CAAG, CTAG, or CTTG) (Menendez et al., 2009). The UGT2B7 p53RE has no spacer between the two 10-base decamers and has the strongest core sequence of CATG at the 5′ decamer. Based on these observations, the putative UGT2B7 p53RE is a highly conserved p53RE.
To identify the EPI-responsive sequence, we mutated this 44-bp region in the −575/−1 promoter context at five positions generating five mutated reporter constructs (termed 2B7-575/-1/MT1-5). As shown in Fig. 4C, there was a 4-bp change in each mutation. Mutants MT1 and MT2 did not alter the p53RE and FXR site sequences. MT3 changed the core sequence of CATG at the 5′ half-site to AGTG (mutated bases underlined), whereas MT4 mutated the core sequence of CAAG at the 3′ half-site to AAAG. In addition to these changes, MT3 and MT4 mutated another 2–3 bases immediately 5′ to the core sequences. MT5 changed 4 bases at the FXR site (5′-GATCCTTGATACGGT-3′, mutated bases underlined). We transfected these mutants into HepG2 cells to see whether they could affect EPI responsiveness. As shown in Fig. 4B, two mutations (MT3 and MT4), which altered the p53RE site, completely abolished the capacity of EPI to stimulate promoter activity. In contrast, the remaining three mutations that mutated the FXR site or sequences upstream of the p53RE had no impact on the EPI-induced UGT2B7 promoter activity. Interestingly, the mutation in the FXR site (MT5) slightly enhanced promoter activity, suggesting that inhibitory effects of FXR on the UGT2B7 promoter were disrupted. FXR has been reported to inhibit UGT2B7 expression in human colorectal adenocarcinoma cell line cells exposed to lithocholic acid (Lu et al., 2005). Collectively, these data indicate that EPI induces UGT2B7 promoter activity through the p53RE in its proximal promoter.
siRNA-Mediated Knockdown of p53 Reduces the Capacity of Epirubicin to Stimulate UGT2B7 Gene Expression.
Having already demonstrated that EPI stimulates UGT2B7 promoter activity via the p53RE, we transfected HepG2 cells with anti-p53 siRNAs to knockdown p53 protein levels to see whether this could repress the capacity of EPI to induce UGT2B7 expression. As shown in Fig. 5A, the anti-p53 siRNA specifically reduced p53 protein levels to approximately 30% of that in nontarget siRNA transfected cells (P < 0.01). p21 (encoding cyclin-dependent kinase inhibitor 1A) and CYP3A4 are p53 target genes (el-Deiry et al., 1993; Goldstein et al., 2013). As shown in Fig. 5B, siRNA-mediated knockdown of p53 expression significantly reduced the induction of EPI on the two p53 target genes (p21 and CYP3A4) as well as UGT2B7, but had no impact on UGT2B10, whose mRNA levels were not elevated by EPI. EPI did not activate PXR in HepG2 cells (data not shown), in agreement with studies showing that overexpression of all three PXR variants does not stimulate UGT2B7 expression (Gardner-Stephen et al., 2004) and that rifampin, an agonist of PXR, has no effect on UGT2B7 promoter activity in HepG2 cells (Jeong et al., 2008). Taken together, these data provide direct evidence for an involvement of p53 in the induction of UGT2B7 expression by EPI. This was further supported by the demonstration that there was a strict correlation between the dose- and time-dependent induction of UGT2B7 by EPI (Fig. 2) and p53 protein levels (Supplemental Fig. 1).

siRNAs against p53 reduce EPI-induced UGT2B7 mRNA levels in HepG2 cells. Briefly, 1.5 ml of fresh DMEM containing HepG2 cells (3 × 10⁵) was combined with 0.5 ml of serum-free DMEM medium containing 10 µl of Lipofectamine 2000 and 10 μl of either anti-p53 siRNA (20 µM) or nontarget siRNA (20 µM) and subsequently plated into 6-well plates. Each transfection was conducted in four wells. Twenty-four hours after transfection, the transfection medium was removed and replaced with fresh DMEM medium. Forty-eight hours after transfection, cells were harvested from one well of each transfection to prepare whole-cell lysate for Western blotting assays. The remaining three wells of each transfection were treated with 1 µM EPI or vehicle (0.1% ethanol) for 24 hours. Cells were then harvested for total RNA, followed by reverse-transcription quantitative real-time PCR to quantify target mRNA. (A) Representative results from Western blotting with an antibody against p53 (top) or β-actin (bottom) in triplicate samples that were transfected with anti-p53 siRNA or nontarget siRNA. (B) Fold induction in target gene mRNA levels in EPI-treated and anti-p53 siRNA-transfected HepG2 cells compared with those (set as a value of 1) in vehicle-treated and nontarget siRNA-transfected cells, respectively. Data shown are means ± 1 S.D. from a representative experiment of three independent experiments performed in triplicate. **P < 0.01. ETH, ethanol.
The p53 Activator Nutlin-3α Stimulates UGT2B7 Gene Expression.
The stability and transcriptional activity of the p53 protein are negatively regulated by its binding to MDM2 (mouse double minute 2 homolog) (Michael and Oren, 2003). Nutlin-3α is a MDM2 antagonist, and its binding to MDM2 disrupts its interaction with p53 (Vassilev et al., 2004). This disassociation stabilizes p53 protein, resulting in its accumulation in the nuclei, thus activating the p53 pathway (Riley et al., 2008; Menendez et al., 2009). We treated HepG2 cells with nutlin-3α to see whether this agent could stimulate UGT2B7 expression. For this purpose, we treated HepG2 cells with nutlin-3α at 10 µM for 24 hours and then performed reverse-transcription quantitative real-time PCR to measure target mRNA levels. The choice of 10 µM nutlin-3α was in line with previous similar cell-based studies (Goldstein et al., 2013). As expected, nutlin-3α stimulated p21 expression (P < 0.01) and did not affect UGT2B10 expression (Fig. 6A). Nutlin-3α significantly increased UGT2B7 expression (P < 0.01), thus verifying UGT2B7 as a p53 target gene. To further confirm that nutlin-3α stimulates UGT2B7 expression through the p53-pathway, we transfected HepG2 cells with anti-p53 siRNAs to reduce p53 protein levels prior to nutlin-3α stimulation. As shown in Fig. 6B, the nutlin-3α–induced mRNA levels of p21 and UGT2B7 in anti-p53 siRNA-transfected cells were only 5 and 18%, respectively, of that in nontarget siRNA-transfected cells. UGT2B10 was not induced by nutlin-3α, and as a result its mRNA levels remained at similar levels in these experiments. Collectively, these data reinforced our notion of UGT2B7 as a novel p53 target gene in HepG2 cells.

Nutlin-3α stimulates UGT2B7 expression and anti-p53 siRNA represses the capacity of nutlin-3α to stimulate UGT2B7 expression in HepG2 cells. (A) HepG2 cells were plated in 6-well plates and cultured for 2-3 days until they reached approximately 80% confluence. Cells were then treated in triplicate with 10 µM nutlin-3α or vehicle (0.1% dimethylsufoxide) for 24 hour. (B) one and one-half milliliters fresh DMEM containing HepG2 cells (3 × 10⁵) was combined with 0.5 ml of serum-free DMEM medium containing 10 µl of Lipofectamine 2000 and 10 μl of either anti-p53 siRNAs (20 µM) or nontarget siRNAs (20 µM) and subsequently plated into 6-well plates. Twenty-four hours after transfection, the transfection medium was removed and replaced with fresh DMEM medium. Forty-eight hours after transfection, cells were treated with 10 µM nutlin-3α or vehicle (0.1% ethanol) for 24 hours. Total RNA was extracted and reverse-transcribed to generate cDNA, followed by quantitative real-time PCR to quantify target gene mRNA levels. Data are presented as fold-induction in target mRNA levels in nutlin-3α–treated cells (A) and anti-p53 siRNA transfected cells (B) compared with those (set as a value of 1) in vehicle-treated cells (A) and nontarget siRNA transfected cells (B), respectively. Data shown are means ± 1 S.D. from a representative experiment of three independent experiments performed in triplicate. DMSO, dimethylsulfoxide. *P < 0.05; **P < 0.01; ¥P > 0.05.
p53 Is Recruited to the UGT2B7 p53 Site in HepG2 Cells in Response to Epirubicin.
ChIP-qPCR was performed to see whether endogenous p53 proteins could bind to the UGT2B7 p53RE in HepG2 cells after stimulation with EPI or nutlin-3α. ChIP assays were performed with an anti-p53 antibody and the rabbit preimmune IgG control for normalizing against possible nonselective background immunoprecipitation. For this purpose, HepG2 cells were treated with 1 µM EPI, 10 µM nutlin-3α, or vehicle (0.1% ethanol) for 24 hours and then subjected to ChIP-qPCR. As shown in Fig. 7A, three UGT2B7 promoter regions were quantified from immunoprecipitated samples, including the p53RE-containing region (−355/−209) and two control regions (−3026/−2907 and −7906/−7747). Data from control region 1 served as a negative control, whereas data from control region 2 were used for normalization of starting amounts of DNA amplified in different samples. For a positive control, the promoter region containing the CYP3A4 p53 site, which was recently shown to be bound by p53 in nutlin-3α–treated HepG2 cells (Goldstein et al., 2013), was also quantified. As shown in Fig. 7B, the binding of p53 to the CYP3A4 p53RE was increased by 2.7-fold (P < 0.05) and 3-fold (P < 0.05) after stimulation with EPI and nutlin-3α, respectively, compared with controls precipitated by equivalent amounts of the irrelevant preimmune IgG serum (designated as IgG) (Fig. 7B). In agreement with our hypothesis, EPI and nutlin-3α increased p53 binding at the UGT2B7 p53RE 6.5-fold (P < 0.01) and 3.7-fold (P < 0.01), respectively. In contrast, neither EPI nor nutlin-3α enhanced p53 binding at the negative control region 1, which is about 3 kb upstream of the p53RE. Taken together, these data clearly demonstrated that p53 is recruited to the UGT2B7 p53RE after EPI stimulation.

p53 is recruited to the UGT2B7 proximal promoter upon exposure to EPI or nutlin-3α in HepG2 cells. Cells were treated with 1 µM EPI, 10 µM nutlin-3α, or vehicle (0.1% ethanol) for 24 hours and subjected to chromatin immunoprecipitation assays, followed by real-time PCR to quantify the precipitated DNA of target sequences as described in Materials and Methods. After normalizing to the data of the negative control region 2, data were expressed as the fold enrichment in DNA samples precipitated with the anti-p53 antibody (FL393) compared with that (set as a value of 1) in the control DNA samples precipitated from equivalent amounts of preimmune IgG serum (IgG). Data shown are means ± 1 S.D. from a representative experiment of three independent experiments performed in triplicates. *P < 0.05; **P < 0.01.
Discussion
In the present study, we identified a functional p53RE in the UGT2B7 proximal promoter that highly resembles the p53RE consensus sequence (Riley et al., 2008; Menendez et al., 2009). We demonstrated that EPI stimulated UGT2B7 promoter activity via this p53RE and enhanced in vivo p53 binding at this site in the hepatic HepG2 cell line. Knockdown of p53 expression by siRNA silencing technology significantly repressed the capacity of EPI to induce UGT2B7 transcription. We further showed that the p53 activator nutlin-3α stimulated UGT2B7 expression and recruited p53 protein to the UGT2B7 p53RE in HepG2 cells. Collectively, these data indicate that UGT2B7 is a novel p53 target gene. This finding is consistent with the important role of p53 in maintaining genome stability upon exposure to genotoxic agents, such as anthracyclines (Horn and Vousden, 2007).
It is well established that p53 is activated in target cancer cells by genotoxic agents including anthracyclines (Tishler et al., 1993; Mansilla et al., 2003). Anthracyclines mainly act as DNA intercalators and topoisomerase II inhibitors to achieve their anticancer activities (Minotti et al., 2004). The intercalation of anthracyclines into DNA prohibits DNA replication and RNA transcription. Inhibition of topoisomerase II activity stabilizes the anthracycline-DNA-topisomerase II ternary complex and prohibits the resealing of the DNA double helix during DNA replication and RNA transcription. This ultimately leads to DNA damage (Cortes-Funes and Coronado, 2007). The rate of damage to DNA depends on the dose of the genotoxic agent and time of exposure. The lag in UGT2B7 induction over the first 8 hours and with lower doses of EPI most likely reflects the time required for generation of EPI-induced DNA damage and elevation in p53 levels (Supplemental Fig. 1).
The accumulation of DNA damage in the nuclei triggers the p53-mediated DNA damage response pathway (Tishler et al., 1993; Mansilla et al., 2003; Horn and Vousden, 2007; Riley et al., 2008; Menendez et al., 2009). Through this pathway, p53 activates transcription of downstream targets that mainly belong to two sets of genes. The first set is involved in cell cycle arrest and DNA repair and allows repair if the damage is mild. The second set of genes is involved in apoptosis, leading to cell death if DNA damage is severe and beyond repair. Our finding of EPI-induced UGT2B7 expression indicates that drug-metabolizing enzymes may represent a novel third set of genes that are mobilized by the p53-mediated response pathway to promote removal of genotoxic agents from target cancer cells. This hypothesis is supported by recent observations that multiple cytochromes P450, including CYP3A4, are p53 target genes (Goldstein et al., 2013). Genotoxic anticancer drugs (e.g., DOX) increased CYP3A4 expression and enzymatic activity in HepG2 cells (Goldstein et al., 2013). We confirmed this finding (data not shown) and further demonstrated that similar to DOX, EPI enhanced CYP3A4 transcription via the p53 pathway in HepG2 cells.
HCC ranks the fifth most frequent cancer and the third leading cause of cancer-related death worldwide (Lin et al., 2012). Chemotherapy is the only treatment option for patients with nonresectable advanced HCC (Lin et al., 2012). DOX and EPI are among the most commonly used chemotherapeutic drugs against HCC (Marelli et al., 2007). To enhance efficacy and reduce systemic toxicity, anthracyclines are usually given by intrahepatic arterial infusion for treating HCC (Marelli et al., 2007). EPI has been administered alone (monotherapy), in combination with mitomycin or cisplatin (double therapy), or together with mitomycin and cisplatin (triple therapy) (Marelli et al., 2007). Because of intrinsic resistance, these EPI-containing regimens achieve only a 10–25% response rate and rapidly lead to treatment failure (acquired resistance) (Lin et al., 2012). Resistance to anthracyclines is not well understood and may be as a result of 1) changes in the expression of uptake (e.g., organic anion-transporting polypeptide 1B1) and efflux (e.g., P-glycoprotein) transporters, 2) modifications in apoptosis machinery, and 3) altered topoisomerase II activity (Piekarski and Jelinska, 2013). Our results from the present study suggest that upregulation of UGT2B7 by EPI in HCC cancer cells might partly contribute to acquired resistance to the above mentioned EPI-based HCC chemotherapy. Cisplatin, a genotoxic anticancer drug, is listed as a CYP3A4/5 substrate (Harmsen et al., 2007). Cisplatin was recently shown to be able to stimulate CYP3A4 expression in HepG2 cells (Goldstein et al., 2013). This facilitates detoxification of cisplatin itself within liver cancer cells. This observation combined with our finding of induction of CYP3A4 by EPI in HepG2 cells suggests that enhanced CYP3A4 activity might play a role in the development of resistance to EPI/cisplatin-containing HCC chemotherapy. In addition to HCC, EPI is used in the treatment of various nonhepatic cancers (e.g., lung, stomach, and bladder carcinomas) that originate from tissues in which UGT2B7 is expressed (Nakamura et al., 2008b). Whether EPI could also stimulate UGT2B7 expression in nonhepatic cancer cellular contexts warrants further investigation. A recent study has shown that EPI was able to stimulate UGT2B7 expression in melanoma cancer cells (Dellinger et al., 2012). However, the molecular mechanism(s) underlying this regulation remained undefined in this study. Because melanoma is resistant to anthracyclines and EPI is not usually used in the treatment of melanoma, the clinical significance of this finding is not clear.
Regulation of UGTs by their substrates (or metabolites) has been frequently reported. Regulation of a UGT by a drug that is primarily metabolized by this UGT may be relevant to therapeutic efficacy, resistance, or toxicity of this drug. Irinotecan, a DNA isomerase I inhibitor, is the first-line anticancer drug for metastatic colorectal cancer. The active metabolite SN-38 (7-ethyl-10-hydroxylcamptothecin) of irinotecan is primarily inactivated by UGT1A1. Studies have shown that overexpression of UGT1A1 in a lung cancer cell line (PC-7/CPT) (Oguri et al., 2004) or induction of UGT1A1 by SN-38 in colon (LS180) and liver (HepG2) cancer cell lines is associated with irinotecan resistance (Basseville et al., 2011). The induction of UGT2B7 by its substrate EPI described in the present study may represent a new example of this type of regulation.
The better tolerability and less cardiotoxicity of EPI compared with other classic anthracyclines have been attributed to its unique hepatic glucuronidation metabolic pathway (Ormrod et al., 1999). This hypothesis is now further supported by our finding that EPI upregulates its own detoxifying gene UGT2B7 in a hepatic cellular context. EPI is administered intravenously in the treatment of nonhepatic cancers (Minotti et al., 2004). After administration, EPI is rapidly distributed into human tissues (Minotti et al., 2004). Early studies have shown that after administration of 10 mg/m2 of EPI to patents within 2–4 hours prior to surgery, the concentration of EPI in liver metastases was 996 ng/g (Italia et al., 1983). This estimate is similar to the maximum EPI concentration of 1 µM used in the present study. The concentration of EPI in liver tissues is expected to be higher than this estimate after therapeutic doses of EPI (60–135 mg/m2) (Minotti et al., 2004). Our finding that EPI enhanced UGT2B7 expression and activity in a hepatic cellular context at therapeutic relevant doses suggests that for treating nonhepatic cancers, EPI may be able to promote its own hepatic systemic clearance. This capacity of EPI to enhance its own systemic clearance could reduce therapeutic efficacy or even contribute to development of acquired resistance to EPI-containing chemotherapy. These hypotheses await further validation clinically and experimentally using other hepatic models such as primary hepatocytes and transgenic mice (Yueh et al., 2011).
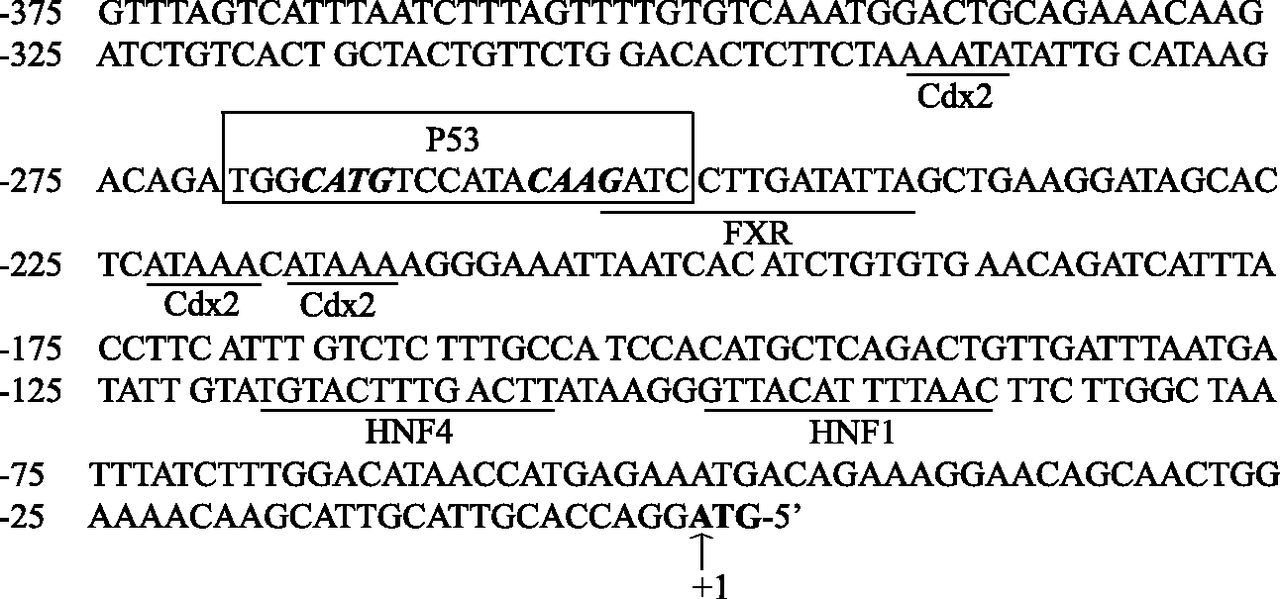
In addition to EPI, UGT2B7 is involved in the glucuronidation of a variety of endobiotics and xenobiotics, including bile acids, steroid hormones, fatty acids, retinoids, nonsteroidal anti-inflammatory drugs, and morphine (Radominska-Pandya et al., 2001). UGT2B7 is expressed in the liver and the gastrointestinal tract (Tukey and Strassburg, 2001; Nakamura et al., 2008b; Ohno and Nakajin, 2009; Izukawa et al., 2009). Regulation of hepatic and gastrointestinal UGT2B7 expression is thus critical for its substrate detoxification and clearance. Regulation of UGT2B7 has been investigated using liver and colon cancer cell lines and transgenic mice. The transcription factors known to regulate UGT2B7 and their relevant cis-activating elements at its proximal promoter are summarized in Fig. 8 (Ishii et al., 2000; Lu et al., 2005; Gregory et al., 2006; Nakamura et al., 2008a; Yueh et al., 2011). Our identification of UGT2B7 as a novel p53 target gene provides new insights into the mechanisms controlling hepatic UGT2B7 expression.

Known transcription factors and their binding sites that are involved in the regulation of the proximal UGT2B7 promoter. Shown are five previously reported transcription factors and their binding sites (underlined) and the novel p53RE (boxed) reported in the present study in the UGT2B7 proximal promoter. Nucleotides of the UGT2B7 promoter are numbered from the translation initiation ATG codon (bold) with A positioned as “+1”. Cdx2, caudal-related homeodomain protein 2; HNF, hepatic nuclear factor.
In conclusion, this study demonstrates that EPI upregulates its own detoxifying enzyme UGT2B7 via the p53-mediated pathway. This regulation may contribute to the development of tumor resistance to EPI-containing HCC chemotherapy and may also provide a new explanation for the better pharmacological profiles of EPI compared with other anthracyclines. Combined with the recently described p53-mediated induction of cytochrome P450 enzymes by genotoxic agents in HCC cell lines (Goldstein et al., 2013), our finding further suggests that genotoxic agent-detoxifying genes may represent a novel group of genes that are activated by the p53-mediated response pathway to clear genotoxic agents locally from the tumor site or possibly systemically from the body through the liver. This decreases chemotherapeutic efficacy and may lead to tumor resistance to genotoxic anticancer drugs.
Authorship Contributions
Participated in research design: Hu, Mackenzie.
Conducted experiments: Hu, Rogers.
Performed data analysis: Hu, Mackenzie.
Wrote or contributed to the writing of the manuscript: Hu, Mackenzie.
Footnotes
- Received January 2, 2014.
- Accepted March 28, 2014.
This work was supported by the National Health and Medical Research Council (NHMRC) of Australia [Grant APP1020931]. P.I.M. is a NHMRC Senior Principal Research Fellow.
↵
 This article has supplemental material available at molpharm.aspetjournals.org.

Abbreviations
- ChIP-qPCR
- chromatin immunoprecipitation assay and quantitative real-time PCR
- DMEM
- Dulbecco’s modified Eagle’s medium
- DNR
- daunorubicin
- DOX
- doxorubicin
- EPI
- epirubicin
- FXR
- farnesoid X receptor
- HCC
- hepatocellular carcinoma
- IDA
- idarubicin
- p53RE
- p53 response element
- PCR
- polymerase chain reaction
- siRNA
- small interfering RNA
- SN-38
- 7-ethyl-10-hydroxylcamptothecin
- UGT
- UDP-glucuronosyltransferase
- Copyright © 2014 by The American Society for Pharmacology and Experimental Therapeutics


