


Abstract
Ginsenoside 20(S)-Rg3 (Rg3) is a steroid glycoside that induces human ether-à-go-go-related gene type 1 (hERG1, Kv11.1) channels to activate at more negative potentials and to deactivate more slowly than normal. However, it is unknown whether this action is unique to hERG1 channels. Here we compare and contrast the mechanisms of actions of Rg3 on hERG1 with three other members of the ether-à-go-go (EAG) K+ channel gene family, including EAG1 (Kv10.1), ERG3 (Kv11.3), and ELK1 (Kv12.1). All four channel types were heterologously expressed in Xenopus laevis oocytes, and K+ currents were measured using the two-microelectrode voltage-clamp technique. At a maximally effective concentration, Rg3 shifted the half-point of voltage-dependent activation of currents by −14 mV for ERG1 (EC50 = 414 nM), −20 mV for ERG3 (EC50 = 374 nM), −28 mV for EAG1 (EC50 = 1.18 μM), and more than −100 mV for ELK1 (EC50 = 197 nM) channels. Rg3 also induced slowing of ERG1, ERG3, and ELK1 channel deactivation and accelerated the rate of EAG1 channel activation. A Markov model was developed to simulate gating and the effects of Rg3 on the voltage dependence of activation of hELK1 channels. Understanding the mechanism underlying the action of Rg3 may facilitate the development of more potent and selective EAG family channel activators as therapies for cardiovascular and neural disorders.
Introduction
Ether-à-go-go (EAG) K+ channel family members are classified into three different subfamilies on the basis of their amino acid sequence and biophysical properties. The EAG subfamily includes two channels (Kv10.1, Kv10.2, or EAG1, EAG2) (Warmke et al., 1991; Saganich et al., 1999), the ether- à-go-go–related (ERG) subfamily includes three channels (Kv11.1–11.3, or ERG1–3) (Warmke and Ganetzky, 1994; Shi et al., 1997), and the ether- à-go-go–like (ELK) subfamily includes three channels (Kv12.1–12.3, or ELK1–3) (Warmke and Ganetzky, 1994; Engeland et al., 1998). As with other voltage-gated K+ (Kv) channels, EAG family channels are tetrameric complexes, formed by coassembly of four identical or highly similar subunits, each containing six transmembrane segments. The first four segments (S1–S4) of each subunit form a voltage sensor domain (VSD), and the S5 and S6 segments from all four subunits together form the pore domain. EAG family K+ channel subunits have unusually large N- and C-terminal cytoplasmic domains and a conserved K+ channel signature amino acid sequence (TSVGFG) that forms the selectivity filter.
The three EAG subfamilies have distinct patterns of tissue expression and diverse physiologic roles (Bauer and Schwarz, 2001). EAG channels are highly expressed in the central nervous system, where they contribute to threshold excitability in brainstem neurons (Hardman and Forsythe, 2009) and excitability of multiple sensory organs, such as the olfactory bulb (Hirdes et al., 2009). EAG channels are also expressed in a wide range of tumor cell lines, where they have a role in cell proliferation (Pardo et al., 1999; Agarwal et al., 2010). ELK channels modulate neuronal excitability, but little is known of their specific functions (Becchetti et al., 2002). ERG channels have diverse biologic and pathogenic roles in many tissues, including the heart, brain, smooth muscle, pancreas, and tumors (Babcock and Li, 2013). In the human heart, human ether-à-go-go–related gene type 1 (hERG1) channels contribute significantly to repolarization of cardiac action potentials. Reduced function of hERG1 channels, caused either by loss-of-function mutations in type 2 long QT syndrome (LQTS) (Curran et al., 1995) or pore block by several common medications, prolongs action potential duration in cardiomyocytes and increases the risk of lethal arrhythmia in susceptible individuals (Sanguinetti and Tristani-Firouzi, 2006).
The most common cause of LQTS is a loss-of-function mutation in hERG1 or KCNQ1 channel subunits. The resulting reduction of repolarizing currents prolongs action potential duration (APD) of the ventricles and increases the risk of potentially lethal arrhythmia. Small-molecule activators of hERG1 channels can shorten cardiac APD and have been proposed as a novel approach for the treatment of LQTS (Sanguinetti, 2014). However, excessive shortening of APD can also increase the risk of ventricular arrhythmia as exemplified by gain-of-function mutations in ion channels that cause short QT syndrome (Bellocq et al., 2004, Hong et al., 2005, Priori et al., 2005). In recent years, several small-molecule activators of hERG1 channels have been discovered and their mechanisms of action were elucidated. RPR-260243 greatly slows the rate of channel deactivation (Kang et al., 2005b, Perry et al., 2007), PD-118057 (Zhou et al., 2005) attenuates inactivation and increases channel open probability (Perry et al., 2009), ICA-105574 nearly eliminates inactivation (Gerlach et al., 2010, Garg et al., 2011), and mallotoxin causes a negative shift in the voltage dependence of activation (Zeng et al., 2006).
20(S)-ginsenoside Rg3 (Rg3), a steroid glycoside, activates hERG1 channels by a combination of mechanisms, including slowed deactivation and shifting the voltage dependence of channel activation by a maximum of −15 mV (Choi et al., 2011a). The relatively modest effects of Rg3 on hERG1 gating are a desirable feature of an activator to be used for treatment of LQTS, because unlike compounds that greatly attenuate inactivation (e.g., ICA-105574) it would not cause excessive shortening of APD or QT interval. Rg3 has been extensively studied and found to block or alter the gating of several other ion channels, but only at much higher concentrations than required to activate hERG1 (Kang et al., 2005a; Lee et al., 2006, 2007, 2008a,b, 2009). It is unknown if Rg3 affects gating of EAG K+ channel family members other than hERG1. It is important to further characterize channel specificity of Rg3 to fully evaluate its potential as a pharmacophore for further development of more potent and specific analogs. Thus, in the present study we have investigated the effects of Rg3 on the gating of representative EAG K+ channel family members, including ERG1, ERG3, EAG1, and ELK1 channels.
Materials and Methods
Molecular Biology.
cDNAs for wild-type (WT) human ERG1 isoform 1a (NCBI reference sequence: NM_000238), rat ERG3 (GenBank accession number AF_016191), human EAG1 (NCBI reference sequence: NM_002238), human ELK1 (NCBI reference sequence: NM_144633), and human Kv1.5 (NCBI reference sequence: NM_002234) were cloned into pSP64, pGEMHE [human ether-à-go-go gene type 1 (hEAG1)], pOX [human ether-à-go-go–like gene type 1 (hELK1)], or pSGEM (Kv1.5) oocyte expression vectors. The vector plasmids were linearized with EcoRI (pSP64), NotI (pGEMHE, pOX), or NheI (pSGEM). cRNAs were transcribed in vitro using mMESSAGE mMACHINE kits supplied by ThermoFisher Scientific (Waltham, MA).
A N-terminal deleted (N-del) hERG1 subunit lacking residues 2–354 was constructed as previously described (Spector et al., 1996). A partially C-terminal-deleted (C-del) hERG1 was constructed by using the XhoI restriction sites after E698 (bp 2089) and before P1018 (bp 3054) of hERG1. This region (bp 2089–3054) was removed by digestion with XhoI. The remaining sequences were ligated back together using T4 DNA ligase such that the final C-del hERG1 included M1-E698 linked by XhoI (CTCGAG) to P1018–S1159 of hERG in pSP64. Subunits lacking both the N- and C-termini (N/C-del) were constructed using the same approach with N-del hERG1 as the starting point.
Separate VSD and pore-domain modules of “split hERG1” were constructed as described by Lörinczi et al. (2015), except that each module was inserted into the pSP64T vector as a fragment flanked by PmeI restriction sites. The subunit was split within the coding region for the S4-S5 linker such that the VSD module consisted of residues 1–545 and the pore module contained residues 546–1159.
Voltage Clamp of Oocytes.
The procedure used to harvest oocytes from Xenopus laevis was as described (Garg et al., 2012) and was approved by the University of Utah Institutional Animal Care and Use Committee. Oocytes were cultured at 17°C in Barth’s solution. Individual oocytes were injected with 1–20 ng cRNA encoding WT and mutant hERG1, rat ether-à-go-go–related gene type 3 (rERG3), human EAG1 (hEAG1), human ELK1 (hELK1), and human Kv1.5 K+ channels. Ionic currents were measured from oocytes 1–4 days after cRNA injection using the two-electrode voltage-clamp technique (Stühmer, 1992). To study “split hERG1” channels, cRNA encoding the VSD module and the pore module (12–20 ng of each cRNA) were coinjected into oocytes and currents were recorded 2–4 days later in oocytes bathed in a solution containing a high concentration (104 mM) of KCl.
Agarose cushion electrodes were fabricated by filling the tips of glass micropipettes (TW100F-4; from World Precision Instruments, Inc., Sarasota, FL) with 1.2% agarose dissolved in 3 M KCl (Schreibmayer et al., 1994). Current and voltage signals were acquired using a GeneClamp 500 amplifier, Digidata 1322A data acquisition system, and pCLAMP 8.2 software (Molecular Devices, Inc., Sunnyvale, CA).
Data Analysis.
pCLAMP 8.2 software (Molecular Devices) was used for data acquisition and analysis. Origin (version 8.6) software (OriginLab Corp., Northampton, MA) was used for further data analysis and to prepare graphs and figures. Data are expressed as mean ± S.E.M. (n = number of oocytes) and, where appropriate, analyzed by two-way analysis of variance (ANOVA) or paired t test. A p value < 0.05 was considered significant.
Concentration-response relationships for Rg3 effects on several measured parameters of channel current were fitted with a logistic equation: where Amax and Amin are the maximum and minimum values of the measured parameter, EC50 is the concentration required for half maximal effect, and nH is the Hill coefficient.
Voltage Dependence of Channel Activation.
For WT hERG1 and rERG3 channels, the voltage dependence of activation was determined by measuring the peak tail currents (Itail-peak) elicited at a return potential (Vret) of −70 mV. The relative conductance–voltage (g/gmax-Vt) relationship for hERG1 and rERG3 channel activation was determined by plotting the normalized value of Itail-peak versus the preceding test voltage (Vt). The data were fitted with a Boltzmann function to obtain the half-point (V0.5) and slope factor (k) for channel activation: For hEAG1 or Kv1.5 channels, the rate of deactivation was too fast to accurately quantify Itail-peak. Therefore, to determine the voltage dependence of activation for these channels, the peak outward current (Itest-max) at each potential divided by the electrical driving force for K+ [Itest-max / (Vt − Erev)] was normalized to its maximum value and plotted as a function of Vt. The resulting conductance-voltage (G-V) relationship was fitted with a Boltzmann function to obtain V0.5 and k for channel activation.
The G-V relationship for split hERG1 channels was poorly fit with a standard Boltzmann function but well described by a model of channel gating that assumes four independent and identical voltage-dependent closed state transitions followed by a final concerted transition to the open state (Koren et al., 1990, Zagotta and Aldrich, 1990). The state diagram and equilibrium constants for this gating model were as previously described (Gonzalez et al., 2000): with the equilibrium constant for closed stated transitions, K = K(0) exp(-z1FV/RT), and the equilibrium constant for the final concerted transition between the fourth closed state (C4) and the open (O) state, Ko = Ko(0) exp(–z2FV/RT). The normalized G-V relationship is described by:
 The voltage dependence of hELK1 channel currents was analyzed by yet another method. From a holding potential of −110 mV, currents were elicited by pulsing to a prepulse potential (Vpre) that was varied in 10-mV increments from –150 to –10 mV. Each prepulse was followed by a test pulse to +20 mV. The onset of currents activated by the pulse to +20 mV were fitted with a single exponential function and extrapolated back to the initial time of the step in voltage to obtain Iinit, a measure of the extent of channel activation induced at each Vpre⋅ Iinit/Itest-max was plotted as a function of Vpre and the resulting relationship fitted with a Boltzmann function to obtain the V0.5 and k for hELK1 channel activation. In the presence of Rg3, the normalized G-V relationships were fit by the sum of two Boltzmann functions:
 Amin1 and Amin2 were fixed to zero, Amax1 + Amax2 = 1, and V0.5(1) and k1 were fixed to the values determined under control conditions. The G-V relationships for C-del and N/C-del hERG1 channel currents were also fitted with a double Boltzmann function.
Voltage Dependence of Channel Inactivation.
The fully activated current-voltage relationship for hERG1 and rERG3 channel currents was determined by applying a 2-second prepulse to +40 mV, followed by repolarization to a Vret that was varied in 10-mV increments from −140 to +30 mV. As described previously (Sanguinetti et al., 1995), the voltage dependence of hERG1 inactivation was determined by fitting the normalized values of Itail-peak / (Vret − Erev) as a function of Vret with a Boltzmann function: For hELK1 channel currents, Itest-max at +20 mV was normalized to its peak value, plotted as a function of Vpre, and fitted with the Boltzmann function to obtain the V0.5 and k for channel inactivation.
Deactivation Kinetics.
For the kinetic analysis of hERG1, rERG3, and hELK1 deactivation (or hEAG1 activation in presence of Rg3), the rate of tail currents was quantified by fitting current decay (or increase) to a biexponential function: to obtain the fast and slow time constants (τf, τs) and relative amplitude of the slow component of deactivation, As/(As + Af). hERG1 deactivation was also quantified by measuring the integral of leak-subtracted 3.5-second and 40-second tail currents (∫Itail) at −70 mV.
Solutions and Drugs.
Barth’s solution contained (in mM): 88 NaCl, 1 KCl, 0.41 CaCl2, 0.33 Ca(NO3)2, 1 MgSO4, 2.4 NaHCO3, 10 HEPES, 1 pyruvate, plus gentamycin (50 mg/liter), amikacin (100 mg/liter), and ciprofloxacin (25 mg/liter); pH adjusted to 7.4 with NaOH. The extracellular salt solution used for voltage-clamp experiments contained (in mM): 98 NaCl, 2 KCl, 1 CaCl2, 1 MgCl2, 5 HEPES; pH adjusted to 7.6 with NaOH. Split hERG1 channel currents were recorded using a high extracellular K+ solution that contained (in mM): 104 KCl, 1 CaCl2, 1 MgCl2, 1 HEPES; pH adjusted to 7.6 with NaOH. 20(S)-ginsenoside Rg3 (Sigma-Aldrich, St. Louis, MO) was dissolved in dimethyl sulfoxide to make a 1 or 10 mM stock solution that was stored at –20°C. Before each experiment, a stock solution was diluted with extracellular solution to produce a final [Rg3] of 0.1–10 μM.
Modeling of hELK1 Currents.
Computational models were developed to reconstruct hELK1 channel currents in the absence and presence of Rg3. The models include a Markovian description of channel gating and a description of K+ current through channels on the basis of the Nernst equation. The Markovian model of hELK1 currents in the absence of Rg3 comprises four closed states, one open and one inactivated state (Fig. 11A). Transition between these states was described by membrane voltage (Vm)–dependent forward rate α and backward rate β: with the rates α0 and β0 at 0 mV, the charges zα and zβ, the temperature T, Faraday constant F, and the gas constant R. Current IhELK through hELK1 channels was described by:
 with the conductance GhELK, the Nernst voltage EK, and the probability that channels are in the open state O. T was set at 293°K. EK was calculated for [K+]o = 2 mM and [K+]i = 114 mM. Parameters of the Markov models were determined using a previously developed stochastic multiscale fitting approach (Abbruzzese et al., 2010, Wu et al., 2014). In short, we defined a fit error E on the basis of feature vectors extracted from experimental data fe and simulation data fm:
 with the number of features n, the Euclidean norm
  , the maximal probability of closed states at the end of a −100 mV pulse, the maximal probability of open and inactivated state during a 60-mV pulse, and weighting factors
  and
and  . Measured features fm included maxima and time constants from exponential fits (Supplemental Table 1).
A multiscale procedure was applied to estimate initial values of the fitting parameters. A first estimate was determined by fitting to reduced data, i.e., features from traces for every third voltage step. The estimates were used for a second fitting using features from traces for every second voltage step. The resulting estimates were applied for a final fitting using all voltage steps. Perturbations were initially in the range of 50–150% of the original parameter value. After each iteration, the perturbation range was decreased to a final range of 98–102%. We used 32 iterations per scale. In each iteration, 960 perturbed parameter sets were evaluated. Subsequently, the 96 parameter sets with the smallest fit error were optimized using the steepest descent method (Press et al., 1992) and used for parameter set perturbation in the next iteration.
To investigate effects of Rg3 on the G-V relationship, we implemented a two-compartment model (Supplemental Fig. 4A). One compartment was derived from the developed six-state model for current in the absence of Rg3. The other compartment lumped together behavior of channels affected by Rg3. For this compartment, we determined forward rates between C0, C1, C2, C3, and O to reproduce V0.5 from fitting of Boltzmann functions to measured g/gmax-Vpre relationships for different Rg3 concentrations. Coupling of the two compartments was implemented by an Rg3 concentration dependent forward rate  and backward rates
  . The rates
  and
and  were defined as:
 We used a measured time constant for the recovery from Rg3 (τrecovery = 19 seconds) for calculation of
  . We applied the weighting parameters, Amax1 and Amax2, from the Boltzmann fit of measured g/gmax-Vpre relationships to calculate
  . We iteratively adjusted
  to account for microscopic reversibility. At first, we adjusted
  in the cycle comprising states C0, C1, Cd,0, and Cd,1 so that the product of rates going clockwise was equal to the product of rates going anticlockwise (Colquhoun et al., 2004). Subsequently,
  were adjusted using the same rule. We then calculated g/gmax-Vpre relationships for each Rg3 concentration by summing open probabilities O and Od from the two-compartment model.
Methods for simulation and model parameterization were implemented using Matlab R2014a (The Mathworks Inc., Natick, MA) and the Matlab Parallel Computing Toolbox. The simulations were carried out with a numerical method for solution of ordinary differential equations (Matlab function: ode15s) using initial values listed in Supplemental Table 2. Simulation data were sampled at a frequency of 1 kHz.
Results
Rg3 Induces a Negative Shift in the Voltage Dependence of Activation and Slows the Rate of Deactivation of ERG Channels.
As previously reported (Choi et al., 2011a), Rg3 enhances hERG1 current magnitude and induces a profound slowing of tail-current (Itail) decay (Fig. 1A). Itest-max, the current measured at the end of a 4-second test pulse, was augmented by Rg3 in a voltage- and concentration-dependent fashion (Fig. 1B). To investigate whether the voltage dependence of channel activation was altered by Rg3, Itail-peak was plotted as a function of Vt and the resulting relationship was fitted to the Boltzmann function (Fig. 1C). Rg3 shifted the voltage dependence of activation to a more negative voltage in a concentration-dependent manner (Table 1). The EC50 for the Rg3-induced shift in the half-maximal voltage required for activation (V0.5) was 414 ± 49 nM (n = 7), and the maximum shift was –13.7 ± 0.7 mV in response to 3 μM Rg3 (Fig. 1D). Rg3 also increased the maximum value of Itail-peak in a concentration-dependent manner (Fig. 1D) with an EC50 of 255 ± 34 nM (n = 7).

Concentration and voltage-dependent effects of Rg3 on hERG1 channel currents. (A) Representative hERG1 currents recorded from a single oocyte before (control) and after treatment with 3 μM Rg3. Small horizontal arrows indicate zero current level. Upper panel shows voltage pulse protocol. (B) Effects of Rg3 on normalized Itest-max-Vt relationships determined before (control) and after achieving steady-state conditions in the presence of indicated concentrations of Rg3 (n = 7). Test pulse duration was 4 seconds. Currents were normalized relative to Itest-max at –10 mV under control conditions. (C) Effects of Rg3 on voltage dependence of hERG1 channel activation using 4-second test pulses. Itail-peak in the presence of Rg3 was normalized relative to the maximum Itail-peak measured under control condition (n = 7). (D) Plots of [Rg3]-dependent effects on maximum Itail-peak and shifts in V0.5 for activation determined using 4-second test pulses. Data were fitted with logistic equation (smooth curves). EC50 = 255 ± 34 nM; nH = 1.11 ± 0.06 (n = 7) for change in maximum Itail-peak. EC50 = 414 ± 49 nM; nH = 1.67 ± 0.12 (n = 7) for shift in V0.5.
Effects of Rg3 on the voltage dependence of activation for ERG channels
To investigate the action of Rg3 on hERG1 deactivation gating, channels were fully activated by applying a 2-second prepulse to +40 mV, followed by a variable Vret that ranged from −60 to −140 mV to elicit tail currents (Fig. 2A). The time-dependent decay of Itail at each Vret was fitted with a biexponential function to define the kinetics of channel deactivation. In the presence of 3 μM Rg3, both the slow and fast time constants (τs, τf) were increased significantly compared with control (Fig. 2B). The voltage-dependent variation of both τs and τf was shifted about –50 mV by 3 μM Rg3, far more than the –13.7 mV shift in the V0.5 for activation observed for this concentration of Rg3. The relative amplitude of the slow component of current deactivation was also enhanced by 3 μM Rg3 (Fig. 2C). The concentration-dependent effects of Rg3 (0.1–10 μM) on hERG1 deactivation was investigated at a single Vret of −70 mV (Fig. 2D). Effects on Itail were quantified by calculating the tail current integral (∫Itail) at 3.5 and 40 seconds and by fitting the full 40-second traces to a biexponential function to estimate the slow and fast time constants for deactivation (τs, τf) before and after exposure of oocytes to each [Rg3]. The maximum fold increase in ∫Itail was 5.1 ± 0.4 (EC50 = 250 ± 22 nM) at 3.5 seconds and 41 ± 6 (EC50 = 556 ± 47 nM) at 40 seconds (Fig. 2E, n = 4–5), indicating the pronounced effect of Rg3 on deactivation. When the decay of Itail was fitted over the full 40 seconds of recording time, the fold increase in τf at −70 mV was 5.2 ± 0.3 (EC50 = 272 ± 90 nM), whereas the fold increase in τs was 11 ± 1.7 (EC50 = 275 ± 51 nM). Rg3 increased the relative amplitude of the slow component of deactivation, As/(As + Af) in a concentration-dependent manner with an EC50 of 196 ± 24 nM (Fig. 2G). The similar EC50 values for the multiple effects of Rg3 on the biophysical properties of hERG1 (Fig. 1D, Fig. 2, E–G) suggest that modification of gating is mediated by interaction with a common binding site. Finally, Rg3 at 3 μM had minimal effects on the fully activated Itail-peak-Vret relationship, V0.5 for inactivation or the time constants for the recovery of channels from inactivation measured over a large range of voltage (Supplemental Fig. 1). Thus, Rg3 modifies both activation and deactivation gating, but it has no effect on inactivation of hERG1 channels.

Rg3 slows the rate of hERG1 channel deactivation. (A) Representative currents recorded in an oocyte under control conditions and after treatment with 3 μM Rg3. Small horizontal arrows indicate zero current level. Upper panel shows voltage pulse protocol. (B) Rg3 (3 μM) slows the time constants for fast (τf) and slow (τs) components of current deactivation (n = 7; two-way ANOVA, p < 0.0001). (C) Rg3 (3 μM) increases the relative amplitude of the slow component of deactivation, As/(As + Af) (n = 7; two-way ANOVA, p < 0.0001). (D) Concentration-dependent slowing of current deactivation by Rg3 in a single oocyte. Currents were activated with a 4-second pulse to 20 mV. Superimposed tail currents were measured for 40 seconds at a Vret of –70 mV. Black arrow indicates zero current level. (E) [Rg3]-response relationships for fold increase in ∫Itail at –70 mV measured after 3.5 seconds or 40 seconds. Data were fitted with logistic equation (smooth curves). EC50 = 250 ± 22 nM (nH = 1.5 ± 0.3) for 3.5 seconds duration (n = 5); EC50 = 556 ± 47 nM (nH = 1.4 ± 0.1) for 40-second duration (n = 4). (F) [Rg3]-response relationships for the fold increase in τs and τf for 40-second deactivation at –70 mV. EC50 = 275 ± 51 nM (nH = 1.5 ± 0.1, n = 4) for τs and 272 ± 90 nM (nH = 1.3 ± 0.4, n = 4) for τf. (G) [Rg3]-response relationships for the relative amplitude of the slow component of deactivation, As/(As + Af). EC50 = 196 ± 24 nM (nH = 2.6 ± 0.7, n = 4). As/(As + Af) under control conditions was 0.23.
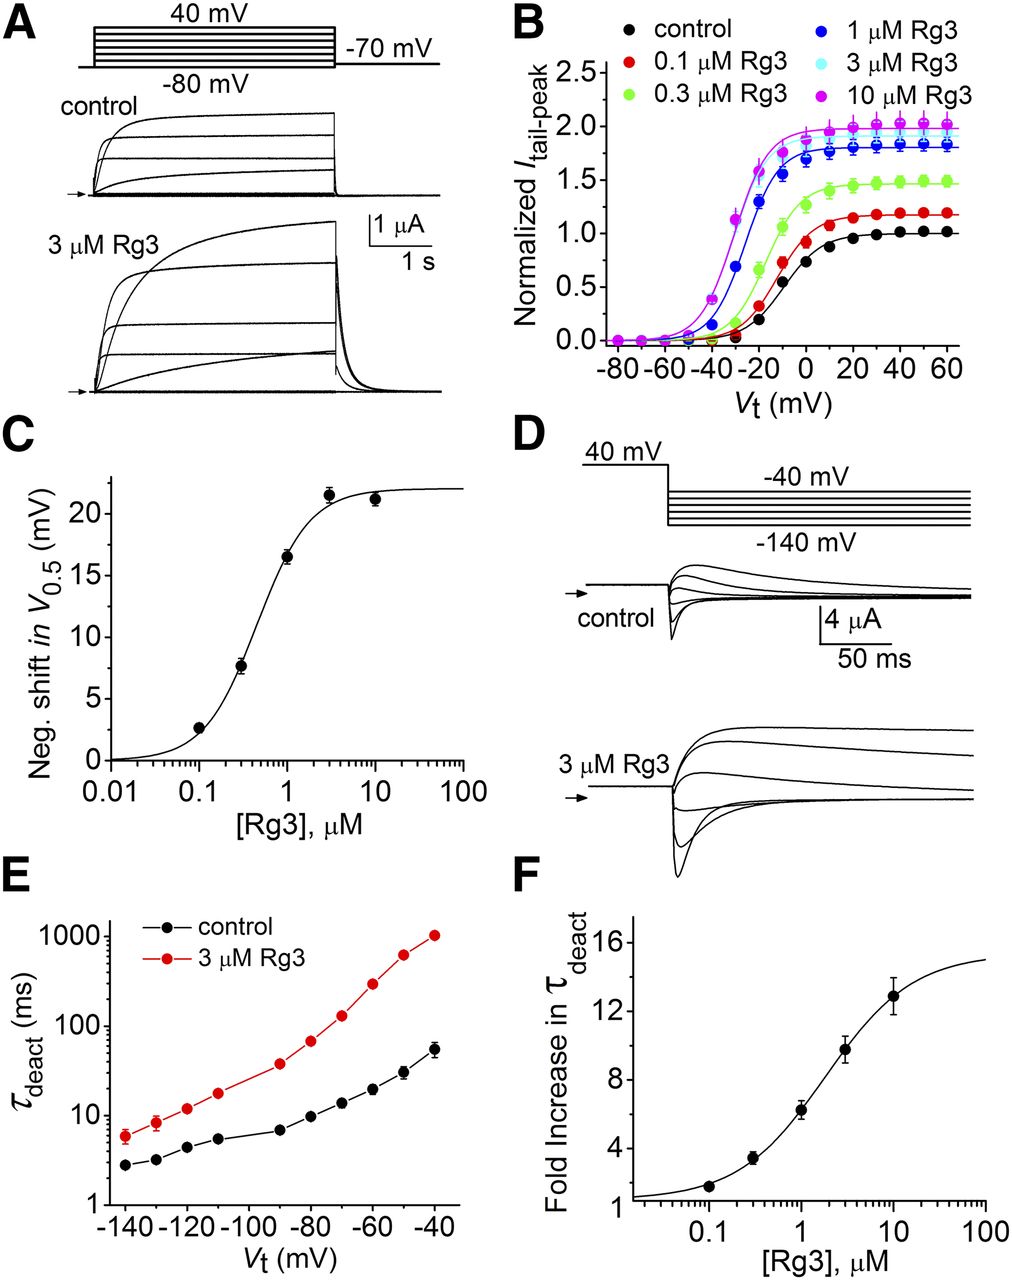
Slow deactivation of hERG1 channels is dependent on a direct interaction between the N-terminus of one subunit and the C-terminus of an adjacent subunit (Gustina and Trudeau, 2011; Gianulis et al., 2013; Li et al., 2014). Thus, the profound slowing of deactivation by Rg3 could result from stabilization of these intersubunit interactions. To examine this possibility, we determined if truncation of either one or both of the N- and the C-termini of hERG1 subunits altered the ability of Rg3 to slow deactivation. As reported previously (Spector et al., 1996), N-del hERG1 channels deactivate much faster than WT channels. Rg3 at 3 μM increased Itest-max and Itail-peak by about 2-fold and greatly slowed the rate of deactivation of N-del hERG1 channel currents (Fig. 3A). Similar to WT hERG1, Rg3 shifted the voltage-dependence of N-del hERG1 channel activation to more negative voltages in a concentration-dependent manner (Fig. 3B). The Rg3-induced shift in V0.5 had an EC50 of 458 ± 25 nM (n = 6), and the maximum shift was approximately –22 mV in response to 3 and 10 μM Rg3 (Fig. 3C). The rate of tail current deactivation was fitted well by a single exponential and was slowed by Rg3 over a wide range of Vret (Fig. 3D), resulting in a –40 mV shift in the voltage dependence of τdeact (Fig. 3E). The [Rg3]-response relationships for the fold increase in τdeact at –70 mV is plotted in Fig. 3F (EC50 = 1.83 ± 0.23 μM, n = 6) and had a maximum of 13, similar to that observed for WT hERG1 channels (Fig. 2F). C-del hERG1 channels activated and deactivated much faster than WT channels, and Rg3 (3 μM) increased the magnitude and slowed the deactivation of these currents (Fig. 4A). Under control conditions the G-V relationship for 1-second test pulses was best fitted with a single Boltzmann function and had a V0.5 of –24.6 ± 1.1 mV and k of 11.1 ± 0.25 (Fig. 4B). The G-V relationship measured after application of 3 μM Rg3 was not well described by a single Boltzmann function, but was fitted well by the sum of two Boltzmann functions. Under the assumption that one component represents the voltage dependence for activation of unaffected channels, we fixed component “1” of the two Boltzmann functions to the value of V0.5 and k measured under control conditions. Component “2,” presumably representing the Rg3-bound fraction of channels, had a voltage dependence of activation (V0.5(2) = –64.7 ± 0.6 mV, k2 = 6.9 ± 0.3) that was shifted by –40 mV compared to component 1 and represented 0.74 of the total current (Fig. 4B). Rg3 at 3 μM slowed the rate of deactivation over a wide range of Vret (Fig. 4C), and increased the value for τdeact (control: 12.0 ± 0.3 ms; 3 μM Rg3: 172 ± 8.5 ms, n = 7) at −70 mV by 14-fold (Fig. 4D). Rg3 had similar effects on N/C-del channels (Supplemental Fig. 2). Together these findings indicate that Rg3 does not slow the rate of hERG1 deactivation by stabilizing interactions between the N- and C-termini of channel subunits.

Concentration and voltage-dependent effects of Rg3 on N-terminal deleted hERG1 channel currents. (A) Representative currents recorded from a single oocyte before (control) and after treatment with 3 μM Rg3. Small horizontal arrows indicate zero current level. Upper panel shows voltage pulse protocol. (B) Effects of 0.1–10 μM Rg3 on voltage dependence of N-del hERG1 channel activation using 4-second test pulses. Itail-peak in the presence of Rg3 was normalized relative to the maximum Itail-peak measured under control condition (n = 6). (C) Plot of [Rg3]-dependent shift in V0.5 for activation (n = 6). Data were fitted with logistic equation (smooth curve); EC50 = 458 ± 25 nM, nH = 1.48 ± 0.10. (D) Representative tail currents recorded in an oocyte under control conditions and after treatment with 3 μM Rg3. Small horizontal arrows indicate zero current level. Upper panel shows voltage pulse protocol. (E) Effect of 3 μM Rg3 on the time constants for current deactivation (τdeact) (n = 6; two-way ANOVA, p < 0.0001). (F) [Rg3]-response relationships for the fold increase in τdeact at –70 mV. EC50 = 1.83 ± 0.23 μM (nH = 1.03 ± 0.05, n = 6).

Concentration and voltage-dependent effects of Rg3 on partially C-deleted hERG1 channel currents. (A) Representative C-del hERG1 channel currents recorded from a single oocyte before (control) and after treatment with 3 μM Rg3. Small horizontal arrows indicate zero current level. Upper panel shows voltage pulse protocol. (B) Effects of 3 μM Rg3 on voltage dependence of C-del hERG1 channel activation using 1-second test pulses. Itail-peak in the presence of Rg3 was normalized relative to the maximum Itail-peak measured under control condition (n = 5). Control data were fitted with a single Boltzmann function (V0.5 = –24.6 ± 1.1 mV, k = 11.1 ± 0.25). G-V relationships measured after application of Rg3 were fitted with the sum of two Boltzmann functions, with component “1” assumed to represent unbound channels having V0.5 and k fixed at control values and component “2” assumed to represent the Rg3-bound fraction of channels. For 3 μM Rg3: Amax1 = 0.26, Amax2 = 0.74, V0.5(2) = –64.7 ± 0.6 mV, k2 = 6.9 ± 0.3. Rg3 data were poorly fit using a single Boltzmann function (dashed smooth curve). (C) Representative tail currents recorded in an oocyte under control conditions and after treatment with 3 μM Rg3. Small horizontal arrows indicate zero current level. Upper panel shows voltage pulse protocol. (D) Effect of 3 μM Rg3 on the time constants for current deactivation (τdeact) (n = 7; two-way ANOVA, p < 0.0001).
In Kv channels, the VSD has been proposed to be electromechanically coupled to the pore domain by the S4-S5 linkers in each subunit (Long et al., 2005). According to this structural model of channel gating, intramembrane displacement of the S4 segments in response to changes in transmembrane voltage is mechanically linked to the opening and closing of the activation gate (the S6 bundle crossing) via the S4-S5 linkers. However, a recent study found that severing the covalent link between the VSD and the pore domain of hERG1 did not prevent gating. Subunits were split apart at the S4-S5 linker into two separate constructs that when coexpressed in Xenopus oocytes resulted in assembly of functional channels that retained relatively normal biophysical properties (Lorinczi et al., 2015). We used the split hERG1 constructs to determine whether the Rg3-induced change in channel gating was dependent on the covalent linkage between the VSD and pore domain. Split hERG1 channels did not express well in oocytes. To increase current magnitude, oocytes were bathed in a solution containing a high level (104 mM) of KCl. Rg3 dramatically increased the magnitude and slowed the deactivation of the split channels. The effects of 3 μM Rg3 on currents recorded from a single oocyte are presented in Fig. 5A, and the normalized Itest-max-Vt relationships for multiple cells (n = 9) determined before and after treatment of oocytes with Rg3 are plotted in Fig. 5B. Rg3 increased the maximum value of Itail-peak by >5-fold (Fig. 5C) and shifted the G-V relationship to a more negative potential (Fig. 5D). Given that the VSD and pore domains of a split channel are not covalently linked, it is not unexpected that its voltage dependence of channel gating differs from WT channels. In the absence of Rg3, the G-V relationship for these channels was not a simple sigmoidal relationship and resembled more some other Kv channels whose gating is well described by a model that assumes four independent and identical voltage-dependent closed state transitions followed by a final concerted transition to the open state (Koren et al., 1990, Zagotta and Aldrich, 1990). Thus, as described in Materials and Methods, we used this model to analyze the G-V relationship for split channels under both control conditions and in the presence of Rg3 (smooth curves of Fig. 5D). This analysis provided a better fit than a standard Boltzmann function (dashed curves in Fig. 5D), but regardless of the method used the shift in V0.5 of the relationship induced by Rg3 was −14 mV, similar to that observed for WT hERG1 channels (Fig. 1D). Thus, the effects of Rg3 on hERG1 channel gating are not dependent on a covalent linkage between the VSD and pore domain.

Rg3 activates split hERG1 channel currents. (A) Representative split hERG1 currents recorded from a single oocyte before (control) and after treatment with 3 μM Rg3. Oocyte was bathed in a solution containing 104 mM KCl. Small horizontal arrows indicate zero current level. Upper panel shows voltage pulse protocol. (B) Effects of Rg3 on normalized Itest-max-Vt relationships determined before (control) and after achieving steady-state conditions in the presence of 3 μM Rg3 (n = 9). Currents were normalized relative to Itest-max at +40 mV under control conditions. (C) Effects of Rg3 on voltage dependence of hERG1 channel activation. Itail-peak in the presence of Rg3 was normalized relative to the maximum Itail-peak measured under control condition (n = 9). (D) Effect of 3 μM Rg3 on normalized G-V relationship of split hERG1 channels. Data were fitted to the five-state model of channel gating (smooth curves, see Materials and Methods). Parameters for model under control conditions were: z1 = 1.40, z2 = 0.974, K(0) = 0.104, Ko(0) = 0.157; in the presence of Rg3: z1 = 1.16, z2 = 0.684, K(0) = 0.136, Ko(0) = 0.043. Data were also fitted to a standard Boltzmann function (dashed curves); control: V0.5 = −17.4 mV, k = 10.7; Rg3: V0.5 = −33.4 mV, k = 8.6.
Effects of Rg3 on rERG3 Channel Gating.
We next examined the effect of Rg3 on another member of the ERG channel subfamily, rERG3. The concentration and voltage-dependent effects of Rg3 on Itest-max are summarized in Fig. 6A. At concentrations of 0.3 μM and higher, Rg3 increased Itest-max at voltages negative to –20 mV and shifted the peak of the Itest-max-Vt relationship to a more negative potential. Consistent with these effects, Rg3 caused a negative shift in the voltage-dependence of channel activation (Fig. 6B, Table 1). The shift in V0.5 for activation by Rg3 achieved a maximum of –20.5 mV at 3 μM with an EC50 of 374 ± 7 nM (n = 8–12; Fig. 6C).

Concentration and voltage-dependent effects of Rg3 on rERG3 channel currents. (A) Effects of Rg3 on normalized Itest-max-Vt relationships determined before (control) and after achieving steady-state conditions in the presence of indicated concentrations of Rg3 (n = 8–12). Test pulse duration was 1 seconds. Currents were normalized relative to Itest-max at –20 mV under control conditions. (B) Effects of Rg3 on voltage dependence of rERG3 channel activation (n = 8–12). Itail-peak in the presence of Rg3 was normalized relative to the maximum Itail-peak measured under control conditions. Symbols are the same as those used in (A). (C) Plots of [Rg3]-dependent effects on maximum Itail-peak and shift in V0.5 for activation. Data were fitted with logistic equation (smooth curves). EC50 = 374 ± 7 nM (nH = 1.7 ± 0.5, n = 8–12) for shift in V0.5, and 417 ± 26 nM (nH = 1.1 ± 0.6) for percentage increase in maximum Itail-peak. (D) Representative tail currents under control conditions and after treatment with 3 μM Rg3. Small horizontal arrows indicate zero current level. Upper panel shows voltage clamp protocol. Prepulse to 0 mV was 1 second in duration. (E) Rg3 (3 μM) increases the time constants for both fast and slow components (τf, τs) of current deactivation (n = 10; two-way ANOVA, p < 0.001). (F) Relative amplitude of the slow component of deactivation, As/(As + Af) is increased by 3 μM Rg3 (n = 10; two-way ANOVA, p < 0.001).
Rg3 increased the maximum Itail-peak by 44% at 3 μM. The effect of 3 μM Rg3 on deactivation of rERG3 channels was determined over a voltage range from –30 to –120 mV (Fig. 6D). Rg3 increased τf and τs for deactivation (Fig. 6E) and the relative amplitude of the slowly deactivating component of Itail (Fig. 6F) at all but the most negative Vret. In summary, Rg3 shifted the voltage dependence of activation and slowed the rate of deactivation of rERG3 channel currents in a manner and potency similar to that observed for hERG1 channels.
Effects of Rg3 on hEAG1 Channel Gating.
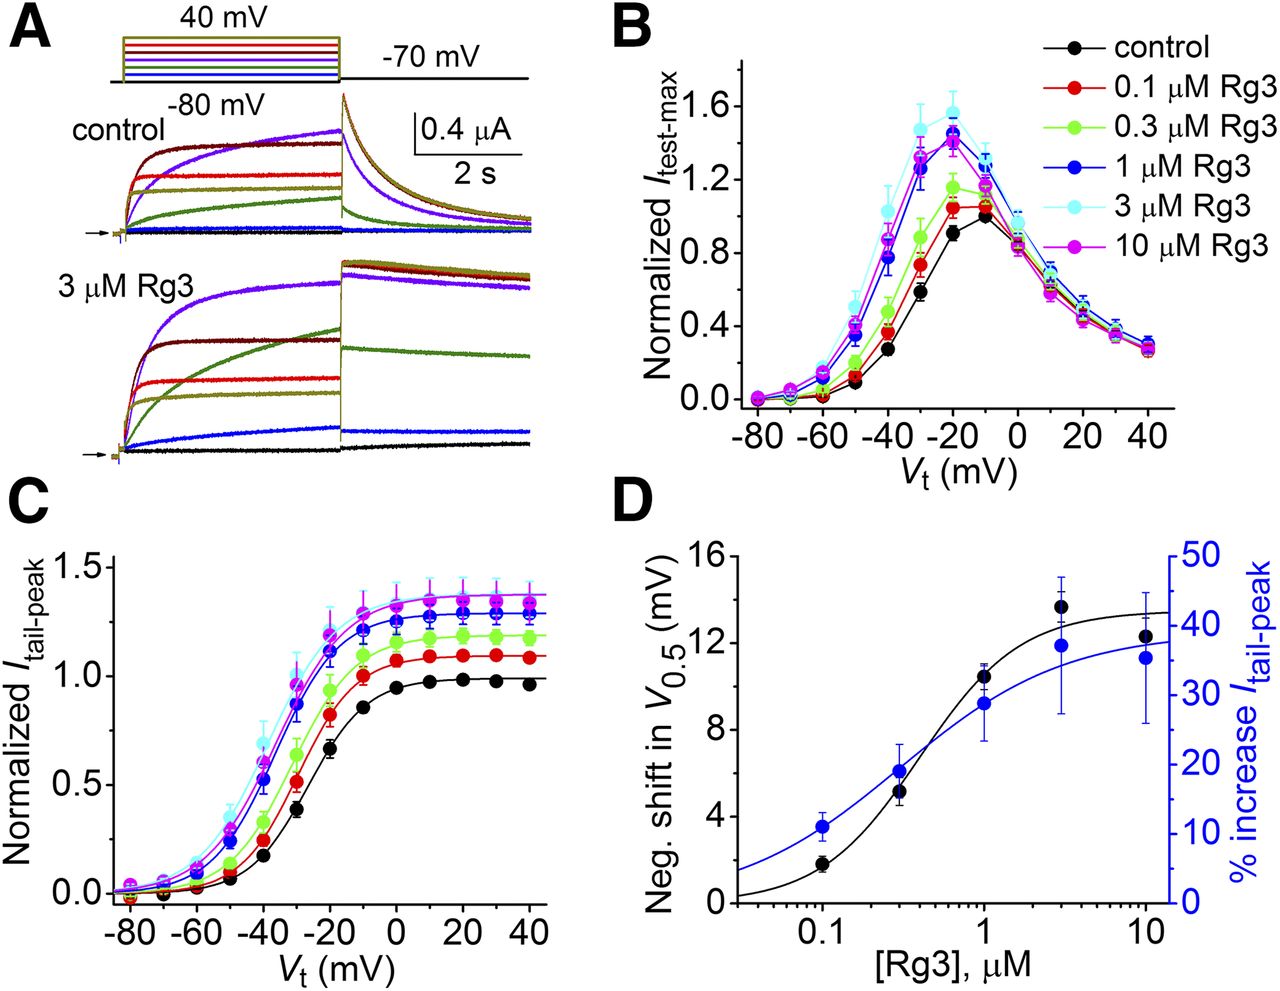
Rg3 increased both the rate of activation and the magnitude of outward hEAG1 currents elicited with 1-second depolarizing pulses (Fig. 7A). Note that tail currents were not evident under control conditions or after treatment of cells with Rg3 when the cell was repolarized to a Vret of −120 mV, indicating that the rate of channel deactivation was faster than the duration of the repolarization-induced whole cell capacitance current. In the absence of quantifiable Itail, the voltage dependence of hEAG1 channel activation was calculated by dividing Itest-max by the electrical driving force (Vt – Erev). As did its effects on ERG channels, Rg3 shifted the voltage-dependence of hEAG1 current activation to more negative potentials in a concentration-dependent manner (Fig. 7, B and C, Table 2). However, the potency of Rg3 on hEAG1 was lower (EC50 = 1.31 μM) and the maximum shift in V0.5 for activation was greater (–28 mV) compared with ERG channels. In response to membrane depolarization from a holding potential of –120 mV, the onset of hEAG1 channel currents was characterized by an initial sigmoidal component, followed by a rapid time course of activation. This current was well described by a single exponential function with a τ that varied from 360 milliseconds at –40 mV to 110 milliseconds at +40 mV (Fig. 7, A and D). After treatment of the cell with 3 μM Rg3, the rate of current activation was accelerated, the initial sigmoidal onset was no longer evident (Fig. 7A), and the time dependence of current activation was best described by a biexponential function with a τf that varied from 16 to 11 milliseconds and a τs that varied from about 240 to 175 milliseconds over the 90 mV range of Vt (Fig. 7D). In the presence of Rg3, the fast component of activation was dominant; the relative amplitude of the slowly activating component of hEAG1 current varied from 0.26 to 0.23 over the 90 mV of Vt (Fig. 7E). In summary, Rg3 increased the magnitude and greatly accelerated the rate of activation of currents and induced a negative shift in the voltage dependence of activation of hEAG1 channels.

Rg3 accelerates the rate and shifts the voltage dependence of activation of hEAG1 channels. (A) Representative hEAG1 currents recorded from a single oocyte before (control) and after treatment with 3 μM Rg3. Upper panel shows voltage pulse protocol. (B) Effects of Rg3 on voltage dependence of hEAG1 channel activation using 2-second test pulses. Rg3 data were normalized relative to gmax under control conditions (n = 8, except for 0.1 and 30 μM Rg3, n = 3). (C) [Rg3]-response relationship for the shift in V0.5 for hEAG1 activation. Data were fitted with a logistic equation (smooth curve). EC50 = 1.31 ± 0.16 μM (nH = 0.70 ± 0.05). (D) Plot of time constants for current activation. Control currents were best fit with a single exponential, whereas currents in the presence of Rg3 were best fit with two exponentials (n = 18). (E) Fraction of the slow component of deactivation, As/(As + Af) for currents measured in the presence of 3 μM Rg3 (n = 18).
Effects of Rg3 on the voltage dependence of activation for hEAG1 channels
Rg3 Produces a Large Negative Shift in the Voltage Dependence of hELK1 Channel Activation.
hELK1 channel currents are activated at more negative potentials than other members of the EAG subfamily of channels (Engeland et al., 1998) and also inactivate slightly at voltages less negative than –100 mV. Therefore, under control conditions, hELK1 channel currents were elicited from a holding potential of –100 or –110 mV and preceded by a 1-second prepulse to –150 mV to ensure that all channels were in a closed state before activation with depolarizing test pulses. As illustrated in Fig. 8A, time-dependent currents were activated in response to a depolarizing pulse to –80 mV or higher potential and a slight time-dependent decay (inactivation) was observed at Vt > 0 mV. After application of 3 μM Rg3, currents were instantaneous in onset at any Vt examined, and the magnitude of Itest-max was decreased and did inactivate at positive potentials (Fig. 8A). The average Itest-max-Vt relationships for hELK1 before and after treatment of oocytes with 3 μM Rg3 (n = 12) are plotted in Fig. 8B. Note that Itest-max was increased modestly by Rg3 when Vt was between –120 and –40 mV but was decreased by Rg3 when Vt was > –20 mV.
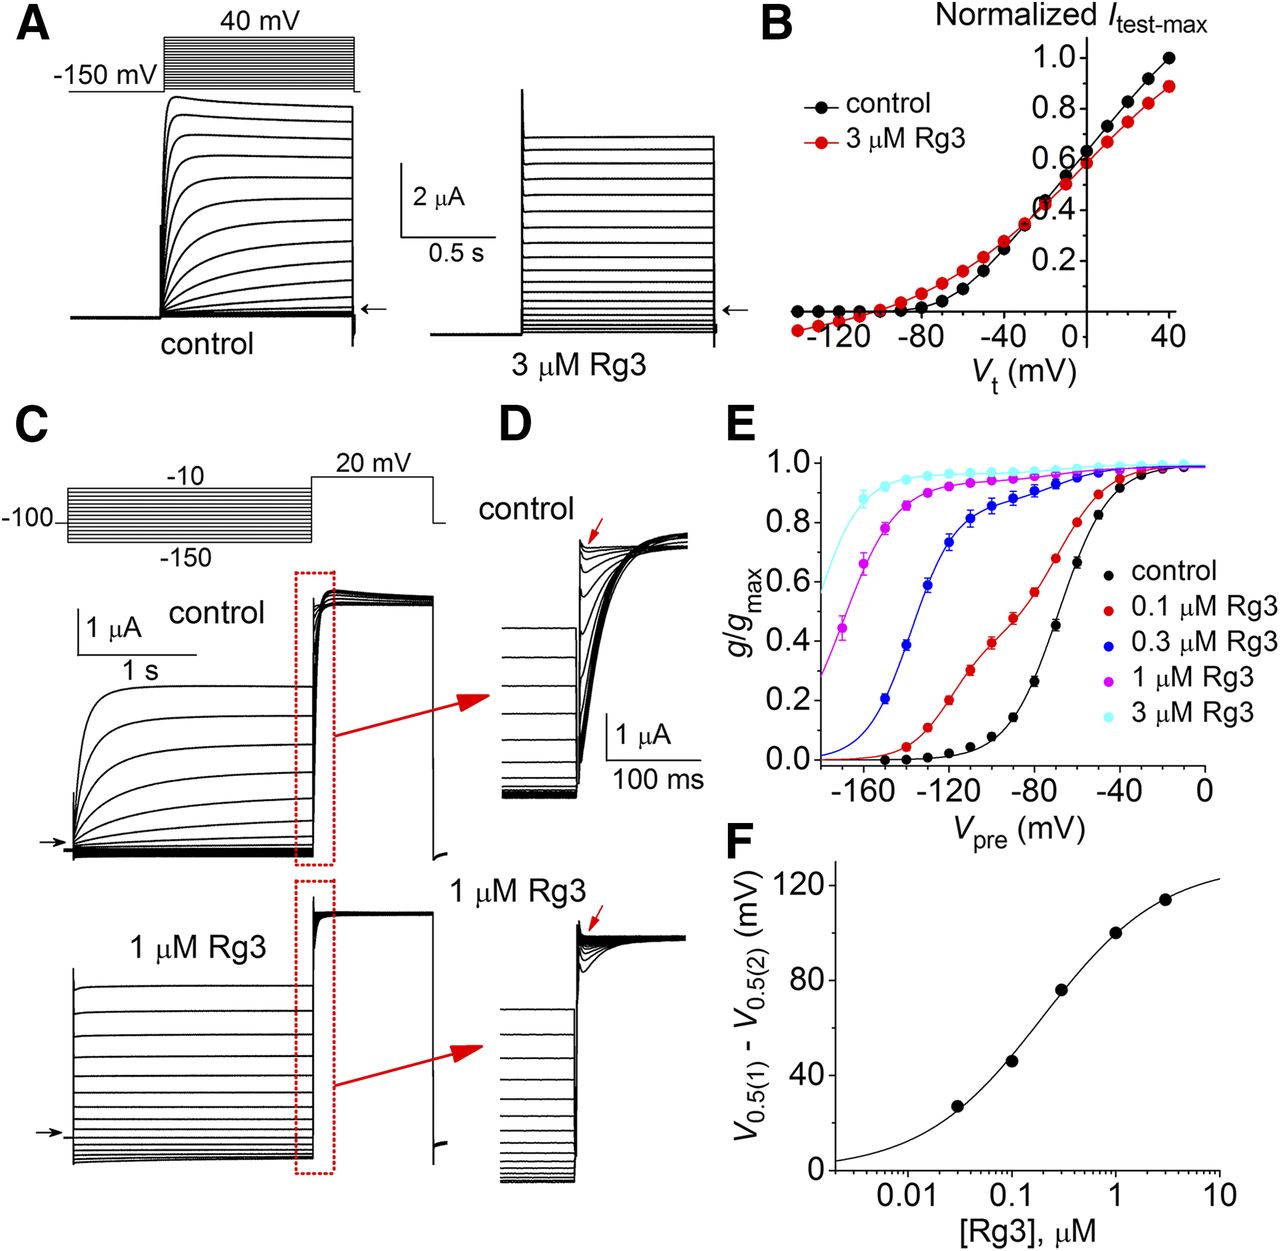
Rg3 induces a large negative shift in the voltage dependence of hELK1 channel activation. (A) Representative example of hELK1 currents recorded from a single Xenopus oocyte before (control) and after application of 3 μM Rg3. The holding potential was –110 mV. A 1-second prepulse to –150 mV was applied before each 1-second test pulse to a Vt that ranged from –140 to +40 mV. Small horizontal arrows indicate zero current level. (B) Normalized Itest-Vt relationships for hELK1 channel currents before and after application of 3 μM Rg3 (n = 12). (C) Voltage pulse protocol and corresponding hELK1 currents recorded before (control) and after application of 1 μM Rg3. Prepulses were applied to a Vpre that was varied from –150 to –10 mV before application of a test pulse to +20 mV. Small horizontal arrows indicate zero current level. (D) Expanded view of current traces during time highlighted by red boxes in (C). (E) G-V relationships for hELK1 channel currents under control conditions and after application of 0.1–3 μM Rg3. Control data were fitted with a single Boltzmann function (V0.5 = –68.9 ± 0.4 mV, k = 11.8 ± 0.3, n = 30). G-V relationships for currents measured after application of Rg3 were fitted with the sum of two Boltzmann functions, with component “1” assumed to represent unbound channels having V0.5 and k fixed at –68.9 mV and 11.8, respectively, and component “2” assumed to represent the Rg3-bound fraction of channels. For 0.1 μM Rg3: Amax1 = 0.6, Amax2 = 0.4, V0.5(2) = –120 ± 0.4 mV, k2 = 9.8 ± 0.3 (n = 5). For 0.3 μM Rg3: Amax1 = 0.12, Amax2 = 0.87, V0.5(2) = –138 ± 0.4 mV, k2 = 10.5 ± 0.4 (n = 6). For 1 μM Rg3: Amax1 = 0.05, Amax2 = 0.94, V0.5(2) = –170 ± 0.4 mV, k2 = 12.5 ± 1.4 (n = 7). The range of relative conductance (g/gmax) for 3 μM Rg3 (n = 9) was too narrow for accurate fitting, but V0.5(2) was estimated to be –184 mV under the assumption that Amin = 0. (F) Average V0.5(1) –V0.5(2) values plotted as a function of [Rg3]. Data were fitted with the logistic equation (smooth curve); EC50 = 197 ± 35 nM; nH = 0.8 ± 0.1.
The kinetics for the onset of, and recovery from, the effects of Rg3 on hELK1 channels was measured by superfusing the small oocyte chamber (volume = 0.2 ml) with solution at a rate of 6.5 ml/min. The rate of Rg3 onset was monitored by measuring the amplitude of initial current (Iinit) in response to a train of 0.6-second pulses to a Vt of 0 mV applied once every 4 seconds from a holding potential of −100 mV. The time constant for the onset (τonset) of 0.3 μM Rg3 effects on Iinit was 6.1 ± 0.8 seconds and the time constant for recovery (τrecovery) was 19.3 ± 1.8 seconds (n = 10, Supplemental Fig. 3).
In the presence of Rg3, the voltage dependence of activation of hELK1 channels was dramatically shifted to more negative potentials. At the very negative Vret that was required to elicit measurable Itail, it is difficult to distinguish between currents produced by deactivating hELK1 channels from time-dependent endogenous Cl– current. Thus, the voltage dependence of hELK1 channel activation was estimated by measuring Iinit, the initial current activated at +20 mV immediately after a 2-second prepulse to a variable Vpre (Fig. 8C). The rates of current activation during the pulse to +20 mV are more easily visualized in Fig. 8D, where currents are depicted on an expanded time-scale. The ratio Iinit/Itest-max before and after treatment of an oocyte with Rg3 were normalized to their peak value determined under control conditions to obtain a measure of the relative conductance (g/gmax) that was plotted as a function of Vpre. The resulting conductance-voltage (G-V) relationships for multiple cells and concentrations of Rg3 are presented in Fig. 8E. Under control conditions, the G-V relationship was well described by a single Boltzmann function with a V0.5 of –68.9 ± 0.4 mV and a slope factor (k) of 11.8 ± 0.3 (n = 30; Fig. 8E, black circles). However, the G-V relationships for currents measured in the presence of 0.1 or 0.3 μM Rg3 were not described by a simple sigmoidal function, perhaps because the data reflect the voltage dependence of activation for two populations of channels (Rg3-bound and Rg3-free). Thus, the G-V relationships for 0.1, 0.3, and 1 μM Rg3 were fitted by the sum of two Boltzmann functions, with the V0.5 and k for one component fixed at the values determined from the single Boltzmann fit under control conditions. Rg3 induced a concentration-dependent negative shift in the more negative V0.5 values of the G-V relationship (representing the presumed Rg3-bound population of channels) with an EC50 of 197 ± 35 nM (Fig. 8F).
The large negative shift in the G-V relationship for hELK1 channels induced by Rg3 and the presence of time-dependent endogenous currents made it difficult to accurately measure rates of current deactivation at very negative potentials in the presence of Rg3. Therefore, we limited our analysis of deactivation to 0.3 μM Rg3 over a limited range on Vret. In the example shown in Fig. 9A, 0.3 μM Rg3 caused a modest slowing of Itail decay at –130 mV. The time-course of Itail was best fit with a double exponential function, and Rg3 increased the time constants for both components τs and τf by 2- to 3-fold (Fig. 9B). The relative amplitude of the slow component of deactivation was unaffected (p = 0.18; Fig. 9C). Thus, in contrast to hERG1 and rERG3 channels, Rg3 induces a much larger negative shift in the G-V for hELK1 channel activation, but a more modest effect on the rate of deactivation.

Rg3 induces a modest slowing of hELK1 channel deactivation. (A) Representative hELK1 tail currents measured before and after treatment of oocyte with 0.3 μM Rg3. Channels were activated by pulsing to 0 mV for 1 second, and tail currents were elicited at –130 mV. Currents were scaled to have equal amplitudes. (B) Fast (τf) and slow (τs) time constants for hELK1 deactivation under indicated conditions (n = 4; two-way ANOVA, p < 0.0001 compared with control). (C) Relative amplitude of the slow component of deactivation, As/(As + Af) is not altered by 0.3 μM Rg3 (two-way ANOVA, p = 0.18).
hERG1 and rERG3 channels exhibit strong voltage-dependent inactivation, greatly reducing the magnitude of outward currents at positive potentials. In contrast, the voltage-dependent inactivation of hELK1 channels is barely detectable, with a maximum decrease in current magnitude of about 5% at positive potentials. The voltage pulse protocol used to determine the G-V relationship for activation was used to estimate the voltage dependence of inactivation for hELK1 channel currents (Fig. 10A). The peak outward currents activated during the second pulse to +20 mV (highlighted by box in Fig. 10A) were normalized to the maximum current elicited after a prepulse to −140 mV and plotted as a function of Vpre to define the voltage dependence for hELK1 inactivation for each oocyte. The normalized G-V relationship for multiple oocytes (n = 28) recorded under control conditions was fitted with a Boltzmann function (Fig. 10B) to determine the voltage dependence of inactivation (V0.5 = −70.5 ± 0.4 mV; k = 8.3 ± 0.3). In a subset of these oocytes we also determined the cumulative effects of 0.1 and 0.3 μM Rg3 (Fig. 10C), or 3 μM Rg3 (Fig. 10D) on the voltage dependence of inactivation. Rg3 at 0.1 and 0.3 μM caused an apparent increase in the extent of inactivation and a negative shift in its voltage dependence (Fig. 10C). Rg3 at 3 μM resulted in an even greater reduction in current magnitude that was only partially recovered by prepulses to −150 and −160 mV.

Rg3 shifts voltage dependence of hELK1 channel inactivation to more negative potentials. (A) Representative currents elicited with voltage pulse protocol shown in upper panel. Boxed area is enlarged to highlight inactivation-induced change in magnitude of currents measured at +20 mV. Large currents are associated with more negative levels of Vpre. Small horizontal arrow indicates zero current level. (B) Voltage dependence of hELK1 channel inactivation under control conditions (n = 28). Data were fitted with Boltzmann function (smooth curve) to determine V0.5 (–70.5 ± 0.4 mV) and k (8.3 ± 0.3). (C) Voltage dependence of hELK1 inactivation (n = 6) determined before (control, V0.5 = –67.8 ± 2.4 mV; k = 6.1 ± 1.6) and after treatment of 0.1 Rg3 (V0.5 = –122 ± 6.6 mV; k = 18.5 ± 3.2) and 0.3 μM Rg3 (V0.5 = –141 ± 1.3 mV; k = 8.6 ± 0.6). (D) Voltage dependence of hELK1 inactivation (n = 7) before (control, V0.5 = –67.3 ± 1.0 mV; k = 9.0 ± 0.6) and after treatment of 3 μM Rg3 (V0.5 = –184 ± 4 mV; k = 15.4 ± 1.5).
Markov Model for hELK1 Channels.
Mathematical models of WT hELK1 channel currents were developed to reconstruct experimental data. The best model for hELK1 channel currents in the absence of Rg3 included four closed states, one open state, and one inactivated state (Fig. 11A). Several variants of this model were explored in the initial development phase. Preliminary studies with a less complex model, i.e., four closed states and one open state, did not yield suitable parameters for reconstruction of hELK1 currents, and the fit errors were considerably larger than for the six-state model. Further studies with more complex models, for instance, the 10-state and 12-state model previously applied by us (Garg et al., 2012) for modeling of EAG1 channels, did not lead to smaller fit errors using the same protocols for parameter optimization as for a six-state model. Additionally, we explored a model with voltage-independent inactivation; however, this model was not further investigated because parameterization led to large fit errors with experimental data. We also explored models with inactivation coupled to closed states. Here the parameterization did not improve fit errors versus the presented six-state model. Preliminary studies also suggested that the current equation implemented on the basis of the K+ reversal potential is superior to using the Goldman-Hodgkin-Katz current equation.

Markov modeling of hELK1 channel gating. (A) Schematic of six-state Markov model. (B) Simulated currents activated by voltage pulses to a Vt ranging from –100 to 40 mV and applied in 20 mV increments. (C) Simulated currents in response to a 1-second Vpre to 0 mV and a 2-second pulse to Vret that was varied from –140 to –50 mV in 10-mV increments. (D) Simulated currents in response to a Vpre that was varied from –150 to –10 mV in 10 mV increments, followed by a Vt to +20 mV. (E) Comparison of simulated and measured Itest-max-Vt relationships. (F) Comparison of simulated and measured voltage dependence of hELK1 channel inactivation. (G) Comparison of simulated and measured G-V relationships for hELK1 activation in the absence (control) and presence of multiple concentrations of Rg3. Simulations were performed with the two-compartment model. The scaling factors for α0 of the model are presented in Supplemental Table S4.
Simulated currents produced by the six-state model are presented in Fig. 11. The rate constant parameters (α0, zα, β0, zβ) for the model are presented in Supplemental Table 3. Modeled currents are presented in Fig. 11, B–D, and predicted and experimental measures of Itest-max-Vt relationships and voltage dependence of inactivation of control currents are presented in Figs. 11, E and F, respectively. Note that simulated currents shown in Figs. 11, B and D, compare well with the experimental currents elicited with the same voltage pulse protocol presented in Figs. 8, A and C. G-V relationships for hELK1 simulated with the two-compartment model under control conditions and after treatment with 0.1–3 μM Rg3 are plotted in Fig. 11G.
We also modeled G-V relationships for hELK1 channels in the presence of multiple concentrations of Rg3 assuming  were slowed or increased (Supplemental Fig. 4). After setting the rates, model parameters were adjusted as described for the original two-compartment model. When the rates were slowed by a factor of 0.01, the G-V relationship (Supplemental Fig. 4B) was unchanged compared with the G-V relationship presented in Fig. 11G. In contrast, when the rates increased by a factor of 100, the G-V relationships appeared to be reduced to a single Boltzmann function (Supplemental Fig. 4C). We explored several model variants for reconstructing Rg3 effects. Evaluation of fit errors yielded the presented two-compartment model on the basis of increased forward rates for voltage-dependent activation and opening in one compartment.
Discussion
Channel Selectivity of Rg3.
Choi et al. (2011a) had previously reported that Rg3 shifts the voltage dependence of activation and slows the rate of deactivation of hERG1, but our study is the first to investigate effects of this compound on other members of the EAG family of K+ channels. Rg3 affects activation gating of EAG family K+ channels with an EC50 that varied from approximately 0.2 μM (hELK1) to 1.2 μM (hEAG1), a potency that is 5–500 times greater than what has been reported for Rg3 to activate or inhibit other voltage-gated channels. For example, Rg3 inhibits Kv1.4 channels with an IC50 of 33 μM (Lee et al., 2008a). We examined Kv1.5 to confirm the relative lack of effect of Rg3 on Kv1 channel gating. At 3 μM, Rg3 reduced the magnitude of Kv1.5 channel currents by only 4% and shifted V0.5 for activation by only +2 mV (Supplemental Fig. 5). Rg3 also blocks KCNQ1 channels with an IC50 of 4.8 μM (Choi et al., 2010) and is a low potency activator (EC50 ∼15 μM) of BKCa channels (Choi et al., 2011b) and KCNQ1/KCNE1 channels (Choi et al., 2010). Rg3 also suppresses a variety of voltage-gated Na+ and Ca2+ channels and ligand-gated channels, including 5-HT3 receptor and α7 nicotinic acetylcholine receptor channels with IC50 values ranging from 16–100 μM (Nah, 2014). Thus, although Rg3 is a nonspecific modulator of multiple channels, the potency of Rg3 activation on EAG family K+ channels is 13–280 times greater than its effects on other ion channels. Screening of more channel types will be required before the relative channel selectivity of Rg3 can be fully understood.
Mechanisms of Rg3 Action.
The major effects of Rg3 described in this study were a shift in voltage dependence of ERG1, ERG3, EAG1, and ELK1 activation, a slowing of ERG and ELK1 channel deactivation, acceleration of hEAG1 channel activation and enhancement of hELK1 inactivation. Rg3 could shift the voltage dependence of channel activation by 1) binding to the VSD and directly stabilizing the S3b-S4 segments in the activated configuration, 2) promoting electromechanical coupling between the VSD and the activation gate, or 3) a combination of both effects.
The relatively slow deactivation of native ERG channels is dependent on an interaction between specific residues in the N-terminal EAG domain [specifically within the Per-Arnt-Sim (PAS) domain or PAS-cap region] and the C-terminus of a neighboring hERG1 subunit (Gustina and Trudeau, 2011; Gianulis et al., 2013; Li et al., 2014), and/or the S4-S5 linker (Li et al., 2010; de la Peña et al., 2011; Ng et al., 2011). It was also recently proposed that specific charge-pair interactions may mediate slow deactivation, including Arg56 in the PAS domain with Asp803 in the CNBHD, and Arg residues in the PAS-cap domain with Glu residues in the C-linker (Ng et al., 2014). Thus, Rg3 could potentially promote a further slowing of deactivation if it stabilized one or more of these proposed N- to C-termini interactions. However, our finding that Rg3 dramatically slowed deactivation of N-del and C-del hERG1 channels, where such interactions are impossible, rules out such mechanisms. Alternatively, Rg3 might promote coupling of the link between the S4-S5 linker and C-terminal region of the S6 segment in hERG1 (Ferrer et al., 2006) and thereby slow the rate of channel closure. While the effects of Rg3 on hERG1 channel gating were independent of a covalent linkage between the VSD and pore domain, the compound may facilitate noncovalent interactions between these two channel regions.
Rg3 activates hERG1 and rERG3 channels by altering three distinct biophysical properties (V0.5 for activation, deactivation rate, current magnitude). The potency of Rg3 for altering these different properties of hERG1 channel function were relatively similar, suggesting that the activity of Rg3 is mediated, either directly or by allosteric mechanisms, by binding to a common binding site on the channel. Rg3 did not alter the voltage dependence of hERG1 channel inactivation. Thus, the [Rg3]-dependent increase in Itail-max is probably caused by an increase in single-channel open probability or an increase in single-channel conductance. Single-channel recordings will be required to further define the mechanism of enhanced current magnitude induced by Rg3.
Rg3 induced only a modest negative shift in the voltage dependence of activation of WT hERG1, N-del hERG1, rERG3, and EAG1 channels. Even in the presence of a maximal effective concentration of Rg3, the G-V relationships for these channels resembled a single Boltzmann function. However, Rg3 induced a much greater shift of activation gating for C-del hERG1, N/C-del hERG1, and hELK1 channels, and the resulting G-V relationships were not adequately described by a single Boltzmann function. Instead, a double Boltzmann function was used to describe the G-V relationships of these channels with one component representing Rg3-free channels and a second component representing a population of channels bound by Rg3. If Rg3 only bound to a single site/channel, the value of V0.5(2) would not have varied with [Rg3]. However, we observed instead that the negative shift in V0.5(2) for hELK1was a function of [Rg3]. This finding suggests that Rg3 binds to more than one receptor site per channel and that the shift in activation gating is in some way proportional to the number of occupied binding sites. Our previous studies of concatenated hERG1 channel tetramers have indicated that other activators such as PD-118057 (Wu et al., 2014), RPR-260243 (Wu et al., 2015), and ICA-105574 (Wu et al., 2014) bind to four identical hydrophobic pockets situated between two adjacent subunits of the tetrameric hERG1 channel complex. A similar concatenated channel approach is required to better understand how Rg3 affects the gating of hELK1 channels.
Modeling of Rg3 Effects on hELK1 Channels.
The developed six-state Markov model combined with a current equation on the basis of the K+ reversal potential successfully reproduced major features of currents through hELK1 channels. Simulations with the two-compartment model support our hypothesis of multiple channel populations in the presence of Rg3, which are activated by a different range of transmembrane voltages (Fig. 11G). However, it is important to note that the Rg3 compartment illustrated in Supplemental Fig. 4A probably represents a diversity of channel populations, consisting of channels bound by one or more Rg3 molecules. Our model relies on the slow off-rate for unbinding of Rg3 from the hELK1 channel that was estimated by measuring the reversal of 0.3 μM Rg3 effects on channel gating during rapid washout of the compound. The rate of recovery from Rg3 effects (τrecovery of 19.3 seconds) was slow compared with the rate of Rg3 onset (τonset = 6.1 seconds), indicating that washout was not hindered by a physical barrier such as the vitelline membrane. Simulations on the basis of a much faster off-rate of Rg3 yielded G-V relationships that are accurately described by single Boltzmann functions. Thus, we suggest that the combination of a slow off-rate for Rg3 and a large negative shift in the voltage dependence of gating by Rg3 result in G-V relationships that are described by the sum of two Boltzmann functions.
Model Limitations.
Although our parameterization approach required only small user interaction, a limitation of this approach is the need for specification of weighting factors  and
and  (Supplemental Table 1). Weighting factors were specified on the basis of visual inspection of simulations reproducing measured data and assumptions for channel gating. Further limitations are related to the development of the two-compartment model for Rg3 effects. We did not explore models with more compartments, which would have been able to describe channel populations with various Rg3 molecules bound to a hELK1 channel. Also, several approaches for setting microscopic reversibility in this model exist (Colquhoun et al., 2004), and it is difficult to identify the most appropriate approach. Our approach for setting microscopic reversibility led to progressively decreased unbinding rates for the pairs of states C0/Cd,0, C1/Cd,1, … C5/Cd,5. We believe that the model is not unique because a preliminary model, which did not account for microscopic reversibility, yielded very similar results (data not shown) as the presented model.
Rg3 Binding Site.
At high concentrations, Rg3 is a nonspecific ion channel modulator; however, it alters the gating of multiple members of the EAG family of Kv channels at submicromolar concentrations. Rg3 is a large compound (MW = 785 Da), consisting of two sugar moieties attached to a steroid structure and its effects on channel gating are rapid in onset, suggesting an extracellular-accessible binding site. Thus, Rg3 probably alters the voltage dependence of channel activation by direct interaction with the outer region of the VSD. Other effects of Rg3 (e.g., increased current magnitude, slowed deactivation) may be mediated by binding to another site or allosteric modulation of channel function via binding to a single extracellular-accessible site. Finally, structural modifications of Rg3 and related ginsenosides may lead to the discovery of more selective and potent gating modifiers of EAG family K+ channels.
Acknowledgments
The authors thank Dr. Timothy Jegla for provision of the hELK1 plasmid.
Authorship Contributions
Participated in research design: Wu, Gardner, Sachse, Sanguinetti.
Conducted experiments: Wu, Gardner, Sanguinetti.
Performed data analysis: Wu, Gardner, Sachse, Sanguinetti.
Wrote or contributed to the writing of the manuscript: Wu, Sachse, Sanguinetti.
Footnotes
- Received February 25, 2016.
- Accepted August 5, 2016.
This work was supported by the National Institutes of Health National Heart, Lung, and Blood Institute [Grant R01 HL055236] to M.C.S.
↵
 This article has supplemental material available at molpharm.aspetjournals.org.

Abbreviations
- ∫Itail
- integral of leak-subtracted tail current
- ANOVA
- analysis of variance
- APD
- action potential duration
- C-del
- C-terminal-deleted
- EAG
- ether-à-go-go
- G-V
- conductance-voltage
- g/gmax
- relative conductance
- hEAG1
- human ether-à-go-go gene type 1
- hELK1
- human ether-à-go-go–like gene type 1
- hERG1
- human ether-à-go-go–related gene type 1
- Itail-peak
- peak tail current
- Itail
- tail current
- Itest-max
- peak outward current
- k
- slope factor for Boltzmann function
- Kv
- voltage-gated K+
- LQTS
- long QT syndrome
- N/C-del
- lacking both the N- and C-termini
- N-del
- N-terminal-deleted
- rERG3
- rat ether-à-go-go–related gene type 3
- Rg3
- 20(S)-ginsenoside Rg3, (2S,3R,4S,5S,6R)-2-[(2R,3R,4S,5S,6R)-4,5-dihydroxy-2-[[(3S,5R,8R,9R,10R,12R,13R,14R,17S)-12-hydroxy-17-[(2S)-2-hydroxy-6-methylhept-5-en-2-yl]-4,4,8,10,14-pentamethyl-2,3,5,6,7,9,11,12,13,15,16,17-dodecahydro-1H-cyclopenta[a]phenanthren-3-yl]oxy]-6-(hydroxymethyl)oxan-3-yl]oxy-6-(hydroxymethyl)oxane-3,4,5-triol
- τf
- fast time constant
- τs
- slow time constant
- V0.5
- half-point (in mV) of Boltzmann function
- Vpre
- prepulse potential
- Vret
- return potential
- VSD
- voltage sensor domain
- Vt
- test potential
- WT
- wild-type
- Copyright © 2016 by The American Society for Pharmacology and Experimental Therapeutics


