


Abstract
Equilibrative nucleoside transporters (ENTs) 1 and 2 facilitate nucleoside transport across the blood-testis barrier (BTB). Improving drug entry into the testes with drugs that use endogenous transport pathways may lead to more effective treatments for diseases within the reproductive tract. In this study, CRISPR/CRISPR-associated protein 9 was used to generate HeLa cell lines in which ENT expression was limited to ENT1 or ENT2. We characterized uridine transport in these cell lines and generated Bayesian models to predict interactions with the ENTs. Quantification of [3H]uridine uptake in the presence of the ENT-specific inhibitor S-(4-nitrobenzyl)-6-thioinosine (NBMPR) demonstrated functional loss of each transporter. Nine nucleoside reverse-transcriptase inhibitors and 37 nucleoside/heterocycle analogs were evaluated to identify ENT interactions. Twenty-one compounds inhibited uridine uptake and abacavir, nevirapine, ticagrelor, and uridine triacetate had different IC50 values for ENT1 and ENT2. Total accumulation of four identified inhibitors was measured with and without NBMPR to determine whether there was ENT-mediated transport. Clofarabine and cladribine were ENT1 and ENT2 substrates, whereas nevirapine and lexibulin were ENT1 and ENT2 nontransported inhibitors. Bayesian models generated using Assay Central machine learning software yielded reasonably high internal validation performance (receiver operator characteristic > 0.7). ENT1 IC50-based models were generated from ChEMBL; subvalidations using this training data set correctly predicted 58% of inhibitors when analyzing activity by percent uptake and 63% when using estimated-IC50 values. Determining drug interactions with these transporters can be useful in identifying and predicting compounds that are ENT1 and ENT2 substrates and can thereby circumvent the BTB through this transepithelial transport pathway in Sertoli cells.
SIGNIFICANCE STATEMENT This study is the first to predict drug interactions with equilibrative nucleoside transporter (ENT) 1 and ENT2 using Bayesian modeling. Novel CRISPR/CRISPR-associated protein 9 functional knockouts of ENT1 and ENT2 in HeLa S3 cells were generated and characterized. Determining drug interactions with these transporters can be useful in identifying and predicting compounds that are ENT1 and ENT2 substrates and can circumvent the blood-testis barrier through this transepithelial transport pathway in Sertoli cells.
Introduction
There is a need to understand and clarify the interactions between the equilibrative nucleoside transporters (ENTs) and nucleoside analogs. These ubiquitously expressed transporters play a role in the pharmacokinetics and drug-drug interactions (DDIs) of nucleoside analogs, which share a similar chemical structure with endogenous substrates of these transporters (http://www.proteinatlas.org; Huber-Ruano and Pastor-Anglada, 2009; Koczor et al., 2012; Pastor-Anglada and Pérez-Torras, 2015; Rehan et al., 2019). Although there is clear value in heterologous expression systems to study the ENTs, the resulting models can be complicated to interpret; the complexity is caused by a variety of issues, including the influence of endogenous nucleoside transport activity (Ward et al., 2000; Sundaram et al., 2001; Yao et al., 2001; Boswell-Casteel and Hays, 2017). The disparity of published results using heterologous models highlights the value of experimental systems with natively expressed ENTs, which have more consistent results in the literature (Lauzon and Paterson, 1977; Plagemann et al., 1978; Dahlig-Harley et al., 1981; Griffith and Jarvis, 1996; Boleti et al., 1997; Mackey et al., 1999; Ward et al., 2000; Miller et al., 2020). Recent work has pharmacologically separated native ENT1 and ENT2 activity in wild-type HeLa S3 cells with the ENT inhibitor 6-S-[(4-nitrophenyl)methyl]-6-thioinosine (NBMPR) (Miller et al., 2020), but there is need for a more efficient, high-throughput method of studying the interactions between individual ENTs and nucleoside analogs.
Nucleoside analogs are used to treat health conditions, including viral infections and cancers, by interfering with nucleic acid synthesis (Ewald et al., 2008; Jordheim et al., 2013). These include the nucleoside reverse-transcriptase inhibitors (NRTIs) and DNA or RNA polymerase inhibitors used to treat various cancers, human immunodeficiency virus, and respiratory viruses (Ewald et al., 2008; Jordheim et al., 2013; Lucas and Nelson, 2015; Jordan et al., 2018). Nucleoside analogs have a long history of success, and this class of therapeutics recently gained attention with the emergency use of the nucleotide analog remdesivir to treat coronavirus disease 2019 (Eastman et al., 2020). Although there are many applications of nucleoside analogs, diseases that persist in sanctuary sites may be more difficult to treat because of the inability of compounds to reach effective concentrations. This includes the testis, where the blood-testis barrier (BTB) may prevent drugs from reaching therapeutically active concentrations within the male genital tract (MGT) (Le Tortorec and Dejucq-Rainsford, 2010; Durmus et al., 2015;). The BTB protects developing germ cells from potentially harmful agents and can interfere with drug disposition to the MGT (Mruk and Cheng, 2015; Miller and Cherrington, 2018). Some viruses are sexually transmitted, and certain cancers negatively impact the structure and function of the MGT. SARS-CoV-2 viral loads are detectable in the semen of infected and recovering patients, indicating that it has the potential to be sexually transmitted (Cardona Maya et al., 2020; Li et al., 2020). Additionally, a clinical trial with Ebola virus survivors is investigating the potential of remdesivir to eradicate the virus from semen to prevent sexual transmission (National Institute of Allergy and Infectious Diseases, 2019). Therefore, it is essential that therapeutics reach effective concentrations in sanctuary sites to reduce viral transmission and/or eradicate the disease in question.
Transporters at the basal and apical membranes of testicular epithelial cells (Sertoli cells) provide a mechanism of bypassing the BTB (Mruk et al., 2011; Miller and Cherrington, 2018). ENT1 on the basal membrane and ENT2 on the apical membrane of Sertoli cells create a transepithelial transport pathway in which substrates of these transporters can enter the seminiferous lumen (Klein et al., 2013). Uridine is a well established substrate of both ENT1 and ENT2 and can be used to study the interaction of various nucleoside analogs on its transport (Ward et al., 2000; Kato et al., 2005; Klein et al., 2013; Miller et al., 2020).
The present study generated the first CRISPR/Cas9 functional knockouts of ENT1 and ENT2 from HeLa S3 cells natively expressing both transporters; the ENT2-knockout cells retained functional ENT1, and the ENT1-knockout cells retained functional ENT2. Interactions of endogenous nucleosides, NRTIs, and an additional set of nucleoside/heterocycle analogs were studied to identify inhibitory interactions with ENT1 and ENT2. Additional transport studies were performed to determine whether four identified inhibitors of the ENTs enter cells through an ENT-mediated mechanism. Bayesian machine learning was used to identify structural elements found in effective inhibitors of ENT1- and ENT2-mediated transport. Predicting interactions with these transporters can aid the development of novel compounds that can cross the BTB using the ENT1-ENT2 transepithelial transport pathway. These include novel antivirals and chemotherapeutics that are substrates for these widely expressed transporters.
Materials and Methods
Reagents.
Oligonucleotide primers were purchased from Integrated DNA Technologies (Coralville, IA). Lysogeny broth (LyB) and LyB agar plates with 50 μg/ml ampicillin and LyB were purchased through the University of Arizona BIO5 Media Facility. Moloney Murine Leukemia Virus Reverse Transcriptase (M-MLV RT), Platinum Taq DNA Polymerase High Fidelity, 10× BlueJuice gel loading buffer, UltraPure ethidium bromide, and the Invitrogen Cells-to-cDNA II Kit were purchased from Invitrogen (Carlsbad, CA). Phusion High-Fidelty Polymerase Chain Reaction (PCR) Mix with Guanine Cytosine content Buffer was purchased from New England Biolabs (Ipswich, MA). Quantum Prep Freeze ‘N Squeeze DNA Gel Extraction Spin Columns were purchased from BioRad (Hercules, CA). [3H]uridine (specific activity 35.2 Ci/mmol) was purchased from Perkin-Elmer (Waltham, MA). Uridine, adenosine, inosine, guanosine, cytidine, thymidine, and nevirapine were purchased from Sigma-Aldrich (St. Louis, MO). 6-NBMPR was purchased from Tocris (Bristol, UK). Abacavir sulfate, entecavir hydrate, zidovudine, didanosine, lamivudine, emtricitabine, tenofovir disoproxil, stavudine, zalcitabine, clofarabine, cladribine, and lexibulin were purchased from Cayman Chemical (Ann Arbor, MI). Thirty-seven nucleoside/heterocycle analogs were identified from the literature, selected, and provided as a generous gift from Gilead Sciences Inc. (Foster City, CA). Additional reagents were purchased from Thermo-Fisher Scientific unless otherwise noted.
Cell Culture.
HeLa S3 CCL-2.2 cells were purchased from American Type Culture Collection and grown in Ham’s F12K Media supplemented with 1.5 g/l sodium bicarbonate, 10% v/v FBS, and 1% v/v penicillin and streptomycin as previously described (Miller et al., 2020). Cells were propagated using the American Type Culture Collection protocol and kept at 37°C in a humidified 5% CO2 incubator. Knockout HeLa S3 cell lines were cultured in the same conditions as wild-type HeLa S3 cells.
Generation of ENT1 and ENT2 HeLa Knockout Cell Lines.
Guide RNA (gRNA) oligonucleotides for ENT1 and ENT2 were designed using the biology software Benchling (San Francisco, CA). The deletion for ENT1 was directed to be located in exon 5 with the gRNA forward sequence 5′- CACCGAGGTAGGTGAATAACAGCA -3′ and the reverse sequence 5′- aaacTGCTGTTATTCACCTACCTC -3′. The deletion for ENT2 was directed to be located in exon 1 with the gRNA forward sequence 5′- CACCGTGGCGCGAGGAGACGCCCCG -3′ and the reverse sequence 5′aaacCGGGGCGTCTCCTCGCGCCAC -3′. The pSp-Cas9(BB)-2A-GFP (PX458) plasmid, a gift from Feng Zhang (Addgene, Watertown, MA) (Ran et al., 2013), was prepared with gRNA inserts for either ENT1 or ENT2 as described by Cong and Zhang (2015). The PX458 plasmid containing the gRNA inserts for either ENT1 or ENT2 was transformed into DH5α cells (New England Biolabs, Ipswich, MA). The transformed DH5α cells were then inoculated on LyB agar plates containing 50 μg/ml ampicillin and incubated at 37°C overnight. Single colonies were then inoculated into LyB supplemented with 100 μg/ml ampicillin and incubated at 37°C overnight in a shaker at 250 rpm. A QIAprep Spin Miniprep Kit (Qiagen, Hilden, Germany) was used to purify the plasmid DNA according to the manufacturer’s protocol. Concentration of the plasmid DNA was determined using a Spectrophotometer NanoDrop ND-1000 (Thermo-Fisher Scientific, Waltham, MA). The purified plasmids were sequenced with the primer: 5′- TTTATGGCGAGGCGGCG -3′ to confirm successful integration of the gRNA inserts.
Wild-type HeLa S3 cells were seeded 200,000 cells/well in a six-well plate 1 day prior to transfection. Cells were incubated with a mixture of 5 μl of LipofectAMINE 3000, 1.25 μl of P3000, and 1.2 μg of plasmid DNA with gRNA inserts for ENT1 or ENT2 in 2 ml of Opti–minimum Eagle’s medium per well for 24 hours at 37°C. Media were replaced 24 hours later, and cells were allowed to recover for 24 hours. Cells were passed and collected in preparation for fluorescence-assisted single-cell sorting using the BD FACSAria III at the Cytometry Core Facility at the University of Arizona. Data were analyzed using BD FACSDiva version 8.0.2. Single fluorescing cells were sorted into individual wells of two 96-well plates per cell line. Clones were maintained until a sufficient number of cells were obtained to assess successful knockout of either ENT1 or ENT2 (Cong and Zhang, 2015; Gaffney et al., 2020).
Polymerase Chain Reaction and Sanger Sequencing.
The Invitrogen Cells-to-cDNA II Kit was used to generate cDNA from wild-type HeLa S3 cells, ENT1 KO cells, and ENT2 KO cells. Approximately 100,000 cells per cell line were harvested and prepared for reverse transcription. Briefly, 10 μl of the lysate was incubated with 1 μl of 10 mM deoxynucleotide triphosphate and 1 μl of 18-mer oligio deoxythymine (dT) primers at 65°C for 5 minutes and briefly chilled on ice. Next, 4 μl of 5× first-strand buffer, 2 μl of 0.1 mM dithiothreitol, 1 μl of Moloney Murine Leukemia Virus Reverse Transcriptase (M-MLV RT), and 1 μl of RNase inhibitor were added (final volume 20 μl) and incubated at 37°C for 50 minutes and then 70°C for 15 minutes.
For PCR amplification of ENT1, 3.5 μl of the cDNA, 1 μl of 10 mM deoxynucleotide triphosphohydrolases, 0.3 μl Platinum Taq DNA Polymerase High Fidelity, 5 μl of 10X PCR buffer, 1.5 μl of 50 mM MgSO4, 36.7 μl of H2O, and 1 μl each of 10 μM forward and reverse primers (total volume of 50 μl) were incubated at 94°C for 3 minutes followed by 35 cycles of the following: 94°C for 45 seconds, 54°C for 30 seconds, and 72°C for 1 minute. After the 35 cycles, the reaction was incubated at 72°C for 10 minutes for final extension. The primers amplify the region containing the deletion. For ENT1, the product size was 419 base pairs with a forward sequence of 5′- GAGGCTGGAGGGACTGGGCTCC -3′ and a reverse sequence of 5′- CAAGGGTGGCAGAGACAAGTGG -3′. Different reaction conditions and PCR buffer were necessary to amplify ENT2 because of high GC content. Briefly, 5 μl of forward and reverse primers (10 μM each), 1.5 μl DMSO, 25 μl 2× NEB Phusion High-Fidelity PCR Master Mix with GC Buffer, 3 μl of cDNA, and 15.5 μl of H2O were incubated at 98°C for 30 seconds, and this was followed by 35 cycles of 98°C for 10 seconds, 68°C for 30 seconds, and 72°C for 30 seconds and a final extension of 10 minutes at 72°C. The product size was 794 base pairs with a forward sequence of 5′- GTGGGTTCCAGCTTTAGGGGTC-3′ and a reverse sequence of 5′- GGGATCGGTGGGAAGGTCACCC -3′.
BlueJuice 10× gel loading buffer (Invitrogen, Carlsbad, CA) was added to the PCR product, and 45 μl was loaded onto a 1% w/v agarose gel containing ethidium bromide and run for approximately 25 minutes at 130 V. PCR product was visualized using UV light, and bands corresponding to correct product sizes were excised and immediately extracted using Quantum Prep Freeze ‘N Squeeze Gel Extraction Spin Columns (Biorad, Hercules, CA). Samples were submitted for Sanger sequencing at the University of Arizona Genetics Core.
Real-Time Quantitative PCR.
cDNA was generated as described above and diluted 1:25 before real-time quantitative PCR. Each reaction contained 2 μl of diluted cDNA, 5 μl of PerfeCTa SYBR Green FastMix (Quantabio, Beverly, MA), 1 μl each of 1 μM forward and reverse primers, and 1 μl of H2O. Each reaction was performed in duplicate per passage, with three passages for each cell line. The reaction conditions were 95°C for 5 minutes followed by 45 cycles of 95°C for 15 seconds and 60°C for 30 seconds using the Rotor-Gene RG-3000 (Corbett Research, San Francisco, CA). Specific primers for ENT1, ENT2, and GAPDH were designed using Primer3 software (Rozen and Skaletsky, 2000) to the 3′ end of the genes, and primers were synthesized by Integrated DNA Technologies (Coralville, IA). The primers for ENT1 are located in exon 14 with a product size of 131 base pairs with a forward sequence of 5′-GCTGGGTCTGACCGTTGTAT-3′ and a reverse sequence of 5′-CTGTACAGGGTGCATGATGG -3′. The primers for ENT2 are located in exon 12 with a product size of 164 base pairs, a forward sequence of 5′-AGCCTGCATGTGTGTACTGC-3′, and a reverse sequence of 5′-ACCACGGACCAGTCACTTTC -3′. The primers for GAPDH were a forward sequence of 5′-CGACCACTTTGTCAAGCTCA-3′ and a reverse sequence of 5′-CCCTGTTGCTGTAGCCAAAT-3′. Cycle threshold values (Ct) values relative to GAPDH expression levels in respective samples were used to determine expression levels of ENT1 and ENT2 using the 2−ΔΔCt method (Livak and Schmittgen, 2001). Expression data are presented as mean fold change (±S.D.).
Cell Growth.
Growth rate was assessed for wild-type HeLa S3 cells, ENT1 KO (ENT2) cells, and ENT2 KO (ENT1) cells. Cells were seeded at 30,000 cells/well in six-well plates, with duplicate wells per day of cell counting. Cells were counted daily using the Nexcelom Bioscience Cellometer Auto T4 cell counter for 5 days, and media were changed every other day. Doubling time was calculated from average cell count from two separate experiments.
Transport Experiments.
Transport experiments were performed as previously described (Miller et al., 2020). All transport buffers were made with Waymouth’s buffer (WB) (2.5 mM CaCl 2H2O, 28 mM D-glucose, 13 mM HEPES, 135 mM NaCl, 1.2 mM MgCl2, 0.8 mM MgSO4 7H2O, pH 7.4), 1 μCi/ml (approximately 20 nM) [3H]uridine, and selected test compounds. Test compound and transport buffer containing [3H]uridine were added to cells simultaneously with no preincubation of test compounds on cells. Inhibition of [3H]uridine uptake by NRTIs was tested at 100 μM, 300 μM, and 1 mM (Fig. 6; Supplemental Table 1). All compounds from Gilead Sciences Inc. arrived as 10 mM solutions in DMSO (Supplemental Table 2). Each compound (200 μM each) was used for experiments to maximize the concentration of the compound used and to maintain below 2% final DMSO (v/v). All controls (100 nM and 100 μM NBMPR; 200 μM adenosine, guanosine, thymidine, inosine, and cytidine) contained 2% DMSO (v/v). Cells (200,000 cells/ml) were seeded into separate Nunc MicroWell 96-well optical bottom plates (Thermo-Fisher Scientific, Waltham, MA) for next-day experiments. Media were aspirated, and cells were washed once with 300 μl of room temperature WB using a Biotek 405 LS Microplate Washer (BioTek, Winooski, VT) before initiating transport by adding 50 μl of transport buffer containing compounds of interest and [3H]uridine using an Integra VIAFLO 96-well multichannel pipette (Integra Lifesciences, Plainsboro, NJ). Transport was terminated after 2 or 7 minutes as indicated in the figure legends by rinsing twice with WB. After washing, 200 μl of MicroScint-20 scintillation cocktail (Perkin-Elmer, Waltham, MA) was added to each well before sealing with microplate film and incubating at room temperature in the dark for at least 2 hours. Total accumulated radioactivity was determined with a Wallac 1450 MicroBeta TriLux liquid scintillation counter (Perkin-Elmer, Waltham, MA).
Determination of Transport by Liquid Chromatography Tandem Mass Spectrometry.
Transport experiments for liquid chromatography tandem mass spectrometry (LC-MS/MS) were completed as described above using 50 μM of lexibulin, clofarabine, and cladribine for both cell lines; 50 μM of nevirapine for ENT2 cells; and 100 μM nevirapine for ENT1 cells. Uptake of compounds was measured in the presence or absence of 100 μM NBMPR. Preliminary experiments determined that an incubation time of 5 minutes produced a detectable transport signal for these compounds; therefore, transport was terminated after 5 minutes. Samples were prepared as described in (Miller et al., 2020). Briefly, after terminating transport, 50 μl of 1:1 methanol:ACN was added to cells containing 10 ng/ml of internal standard and incubated overnight at 4°C. The internal standard was abacavir for lexibulin and nevirapine. The internal standard for clofarabine was cladribine and vice versa. Calibration curves were also prepared in methanol:ACN and treated identically to samples. Samples were dried and resuspended in 50 μl of 90:10 H2O:ACN + 0.1% formic acid for lexibulin and nevirapine and in 50 μl of H2O + 0.1% formic acid for clofarabine and cladribine. Debris was removed by centrifuging at maximum speed for 10 minutes in a table-top centrifuge, and the supernatant was collected for LC-MS/MS analysis.
A Shimadzu Prominence HPLC system (Shimadzu, Kyoto, Japan) coupled to a SCIEX QTRAP 4500 mass spectrometer (SCIEX, Framingham, MA) was used to detect intracellular accumulation of selected compounds. Clofarabine, cladribine, nevirapine, lexibulin, and abacavir were detected by positive electrospray ionization with the following source parameters: 5.5 kV ion spray voltage, 500°C source temperature, 20 psi nebulizer gas, 40 psi turbo gas, and 9 psi collision gas. Analyte intensity was determined by multiple reaction monitoring as noted in Supplemental Table 3. Ten microliters of each sample was injected onto a Luna Omega polar C18 column (50 × 2.1 mm with 1.6 μm bead diameter; Phenomenex, Torrance, CA). For clofarabine and cladribine, analytes were separated over a binary gradient consisting of H2O with 0.1% formic acid (A) and acetonitrile with 0.1% formic acid (B) at a flow rate of 0.3 ml/min as follows: 0% B (0 to 1 minute), 0%–80% B (1–5 minutes), held at 80% B for 1 minute, and this was followed by a decrease from 80% to 0% B (6–7.5 minutes). Lexibulin, nevirapine, and abacavir analytes were separated over a binary gradient consisting of water with 0.1% formic acid (A) and acetonitrile with 0.1% formic acid (B) at a flow rate of 0.3 ml/min as follows: 10% B (0–1 minute), 10%–90% B (1–3 minutes), 90% B (3–4 minutes), 90% to 10% B (4–4.5 minutes), and 10% B (4.5–6 minute).
Assay Central Bayesian Models.
Assay Central software was used to build machine learning models and prediction generation methods and evaluate metrics of predictive performance and the interpretation of prediction and applicability scores as previously described (Clark et al., 2015; Clark and Ekins, 2015, Zorn et al., 2019). Initially, a series of scripts employing standardized rules was applied to detect problematic data (including abnormal valences and mixtures) and correct them by multiple methods (i.e., structures were desalted and neutralized, finite activities merged, potentially incorrect structures were flagged for review) to then output a high-quality structure-activity data set. A Bayesian algorithm was then applied to the structure-activity data sets generating extended-connectivity fingerprints 6 as molecular descriptors for structures, and the corresponding activity was either binary or set according to a user-defined threshold for a Boolean classification (Clark et al., 2015; Clark and Ekins, 2015). The resulting machine learning model could be used to predict the probability of target activity from chemical structure alone. Prospective molecule applicability was evaluated by a score in which a higher value suggested higher fragment representation in the model to ensure a given prediction was within the scope of the training data. Prediction scores were evaluated according to the standard probability cutoff, wherein a value of ≥0.5 designates a chemical as active (Clark et al., 2015; Clark and Ekins, 2015).
Herein, we have applied Assay Central machine learning methods to ENT1 and ENT2 inhibition of [3H]uridine uptake into cells. Bayesian machine learning models were constructed from the percent uptake data generated from 44 unique compounds: 37 compounds provided in Supplemental Table 2 and five endogenous nucleosides as well as three tracers (two unique). Training data were binarized so that an active compound (i.e., an inhibitor of ENT1 or ENT2) was considered one that inhibited >50% average [3H]uridine uptake. No structural corrections were necessary.
Additionally, we externally validated a machine learning model built from ChEMBL IC50 data to evaluate whether machine learning could correctly predict the ENT1 results generated in this study. Specifically, training data were pulled from Target identification 1997 (https://www.ebi.ac.uk/chembl/target_report_card/CHEMBL1997/) for human ENT1, and the activity threshold was set so that a compound was considered active if the reported IC50 was <100 µM. The two test sets were comprised of all compounds (Supplemental Table 2), five endogenous nucleosides, and three additional compounds; all compounds had percent uptake, and 27 had estimated-IC50 data against ENT1. Estimated-IC50 values were calculated using eq. 4, and uptakes were determined in the absence of inhibitor and in the presence of each inhibitor at 200 µM. Five compounds were in the training model ([3H]uridine + 5 mM uridine, [3H]uridine + 100 nM NBMPR, [3H]uridine + 100 µM NBMPR adenosine, and tecadenoson), and they were removed from this test set. Testing compounds were binarized so that an active compound was considered one that produced <50% of control uptake or an estimated IC50 < 100 µM. External validation, which we term a “subvalidation,” was applied within Assay Central so that the binarized ChEMBL training set was applied to predict each individual test set and output performance metrics. Individual predictions that culminate in these metrics are provided in Supplemental File 1 with the five removed compounds noted as “In model” for the applicability score. Only minimal structural corrections were necessary (i.e., removing salt components, omitting 49 compounds that did not provide an IC50 value). Additional information on the generation of Assay Central Bayesian Models is included in the Supplemental Files under “Assay Central® User Manual” of Sandoval et al. (2018).
Data Analysis.
Each experiment was completed with cells cultured from multiple passages and multiple replicates per passage as indicated in the figure legends and predetermined before conducting the experiment. Data are presented as mean ± S.D. unless otherwise noted and completed using GraphPad Prism 8 (San Diego, CA). For analysis of cell growth data, two-way ANOVA with Sidak’s correction for multiple comparisons (12 comparisons per family) was used to compare the mean cell count of knockout cells to wild-type cells (P < 0.05). Doubling time was calculated by fitting the exponential growth equation to cell growth data: (1)in which Y0 is the initial amount of cells seeded (30,000), X is hours, and k is the rate constant.
The IC50 value of NBMPR, abacavir, nevirapine, lexibulin, clofarabine, and cladribine on ENT1-and ENT2-mediated [3H]uridine uptake was determined using the following equation: (2)in which J is total uridine transport, Japp is a constant (Jmax for uridine times the ratio of the IC50 for the inhibitor and the Kt for uridine), T is [3H]uridine concentration, and S is NBMPR concentration. We estimated the initial rate of uridine uptake at 2 minutes. The nonsaturable/mediated component of total net accumulation, Kd, was determined using eq. 3a and has units of µl·cm−2·min−1. This value was subtracted from total uridine uptake at each substrate concentration to generate values for Jmax and Kt (eq. 3b), as previously described for wild-type HeLa cells (Miller et al., 2020):
 (3a)
(3a) (3b)An unpaired two-tailed t test was used to calculate the statistical difference between each kinetic parameter, NBMPR IC50 values, and transport determination studies (P < 0.05 indicating a difference in kinetic parameters or NBMPR IC50 values, P > 0.05 indicating no difference). An extra sum-of-squares F-test and comparison of fits were used to calculate the statistical difference between IC50 values generated from best-fit lines for endogenous nucleosides and estimated-IC50 values for nucleoside analog/heterocycle analog interaction studies (P < 0.05 indicating an difference in IC50 values between ENT1 and ENT2, P > 0.05 indicating no difference). Data in Tables 2⇓–4 are presented as mean and 95% confidence intervals. Ordinary one-way ANOVA with Dunnett’s correction for multiple comparisons comparing the mean of a column to the control column (i.e., [3H]uridine uptake only) was used for experiments with NRTIs (Fig. 6) and nucleoside/heterocycle analogs (Fig. 7). For nucleoside/heterocycle analogs that inhibited [3H]uridine uptake, a comparison of fits of eq. 4 and extra sum-of-squares F-test were done to compare the values for each cell line. IC50 values for these compounds were estimated from inhibition experiments using eq. 4 as previously described (Kido et al., 2011; Sandoval et al., 2018):
 (4)in which J0 represents ENT-mediated transport rate in the absence of the inhibitor, and J represents ENT-mediated transport rate in the presence of the inhibitor. I is the inhibitor concentration (200 μM).
Results
Generation and Characterization of ENT1 and ENT2 Knockout Cell Lines.
Successful deletion of ENT1 and ENT2 was confirmed in HeLa S3 cells using PCR and Sanger sequencing. Figure 1, A and B show the location of the deletions in each cell line. For the ENT1 KO cells, there is a two-nucleotide deletion in exon 5. For the ENT2 KO cells, there is a 14 nucleotide deletion in exon 1. Hereafter, these cell lines are referred to as ENT1 or ENT2 cells, named after the transporter that remains functional. Cell growth of the newly generated cell lines was also assessed. After 5 days in culture, both cell lines had a lower total cell count than wild-type HeLa S3 cells (Fig. 1C) (P < 0.001 for ENT1 cells, P < 0.05 for ENT2 cells). The doubling time was calculated using eq. 1. For wild-type HeLa cells, the doubling time was 22.78 hours (95% CI: 18.47–27.95). For ENT1 cells, the doubling time was 22.0 hours (95% CI: 17.55–27.41). For ENT2 cells, the doubling time was 22.14 hours (95% CI: 18.43–26.48). The mRNA expression levels were measured in both knockout cell lines relative to wild-type HeLa cells (Fig. 1D). The mRNA expression of ENT1 and ENT2 modestly decreased relative to wild-type cells in the ENT1 cells. However, in ENT2 cells, mRNA expression of both ENT1 and ENT2 decreased relative to wild-type cells.
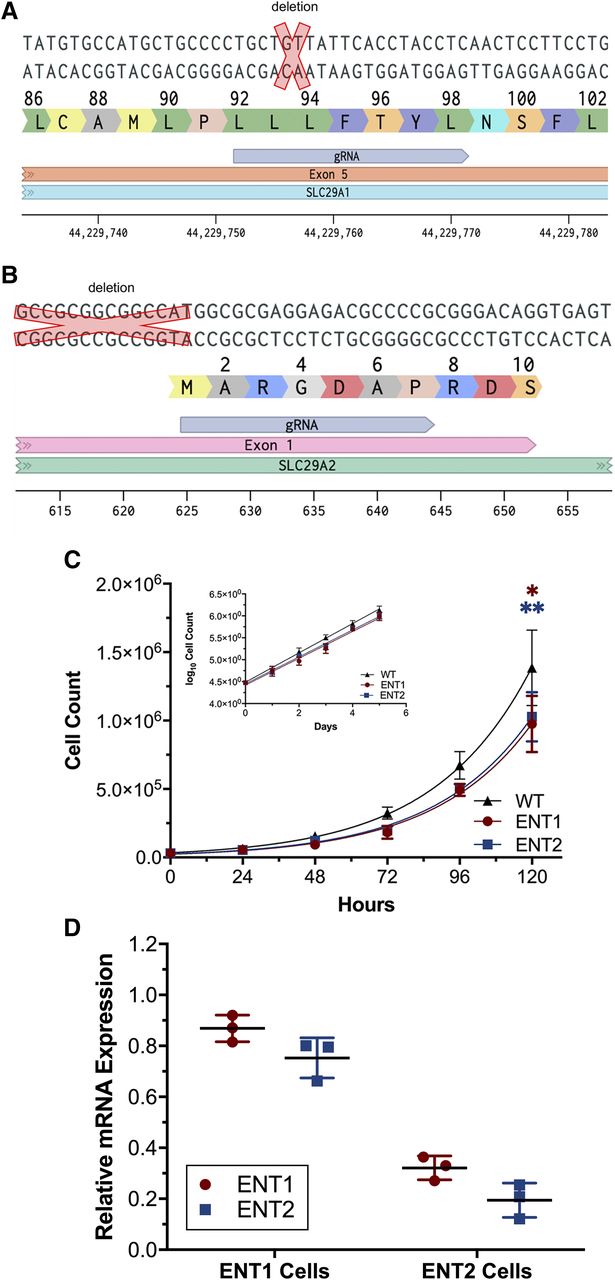
Characterization of ENT1 and ENT2 KO cell lines. (A) Location of deletion in SLC29A1 exon 5 (red “x”) and gRNA used for generation of the ENT1 KO (ENT2) cells. (B) Location of deletion in SLC29A2 in exon 1 (red “X”) and gRNA used for generation of the ENT2 KO (ENT1) cells. DNA sequence 5′ to 3′ is shown for (A and B) as well as the amino acid sequence. (C) Growth curve of wild-type HeLa S3 cells and ENT1 and ENT2 cells. Log10-transformed cell growth data are also plotted. Total cell count data were analyzed using two-way ANOVA with Sidak’s multiple comparisons test (*P < 0.05; **P < 0.005, indicating difference from wild-type HeLa S3 cells). Data are presented as mean ± S.D. with n = 2 in duplicate. (D) Real-time PCR mRNA expression of ENT1 and ENT2 in ENT knockout cells relative to wild-type HeLa S3 cells. Relative ENT1 expression (red) and relative ENT2 expression (blue). Data are presented as mean ± S.D. with n = 3 in duplicate. WT, wild type.
Functional Assessment of ENT1 and ENT2 Cell Lines.
We measured the accumulation of [3H]uridine over the course of 7 minutes in both cell lines to evaluate the functional loss of ENT1 or ENT2. A saturating concentration of unlabeled uridine (5 mM) was used to establish the fraction of total uridine accumulation that was carrier-mediated. Although there was only a modest decrease in mRNA expression of ENT2, >96% of [3H]uridine uptake was mediated by ENT1 in ENT1 cells (Fig. 2A). In ENT2 cells, >90% of [3H]uridine uptake was mediated by ENT2 (Fig. 2B). The IC50 of NBMPR for each transporter was determined using eq. 2. For ENT1, the IC50 was 13.81 (95% CI: −0.104 to 28.66) nM, and for ENT2, the IC50 was 1.85 (95% CI: 0.245–3.44) μM (Fig. 3, P = 0.0078).
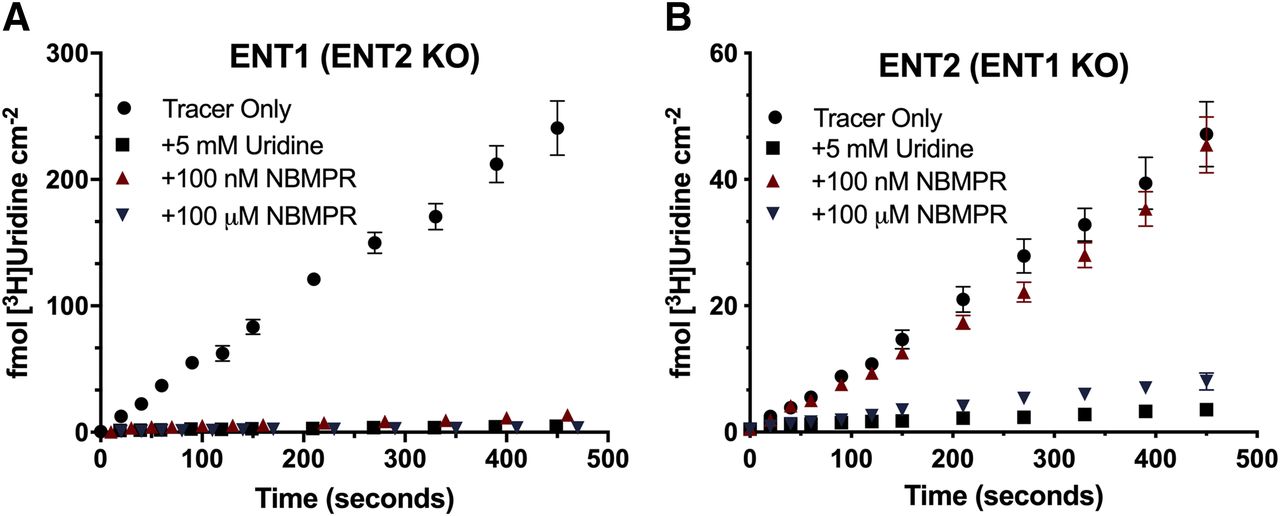
Inhibition of [3H]uridine uptake in ENT2 and ENT1 knockout cell lines. Approximately 20 nM [3H]uridine was incubated with 5 mM uridine (black square), 100 nM NBMPR (red triangle), or 100 μM NBMPR (blue triangle) in the ENT1 cell line [ENT2 KO, (A)] and the ENT2 [ENT1 KO, (B)] up to 7 minutes. Total accumulated [3H]uridine was measured. Data are represented as mean ± S.D. with n = 3 in triplicate.
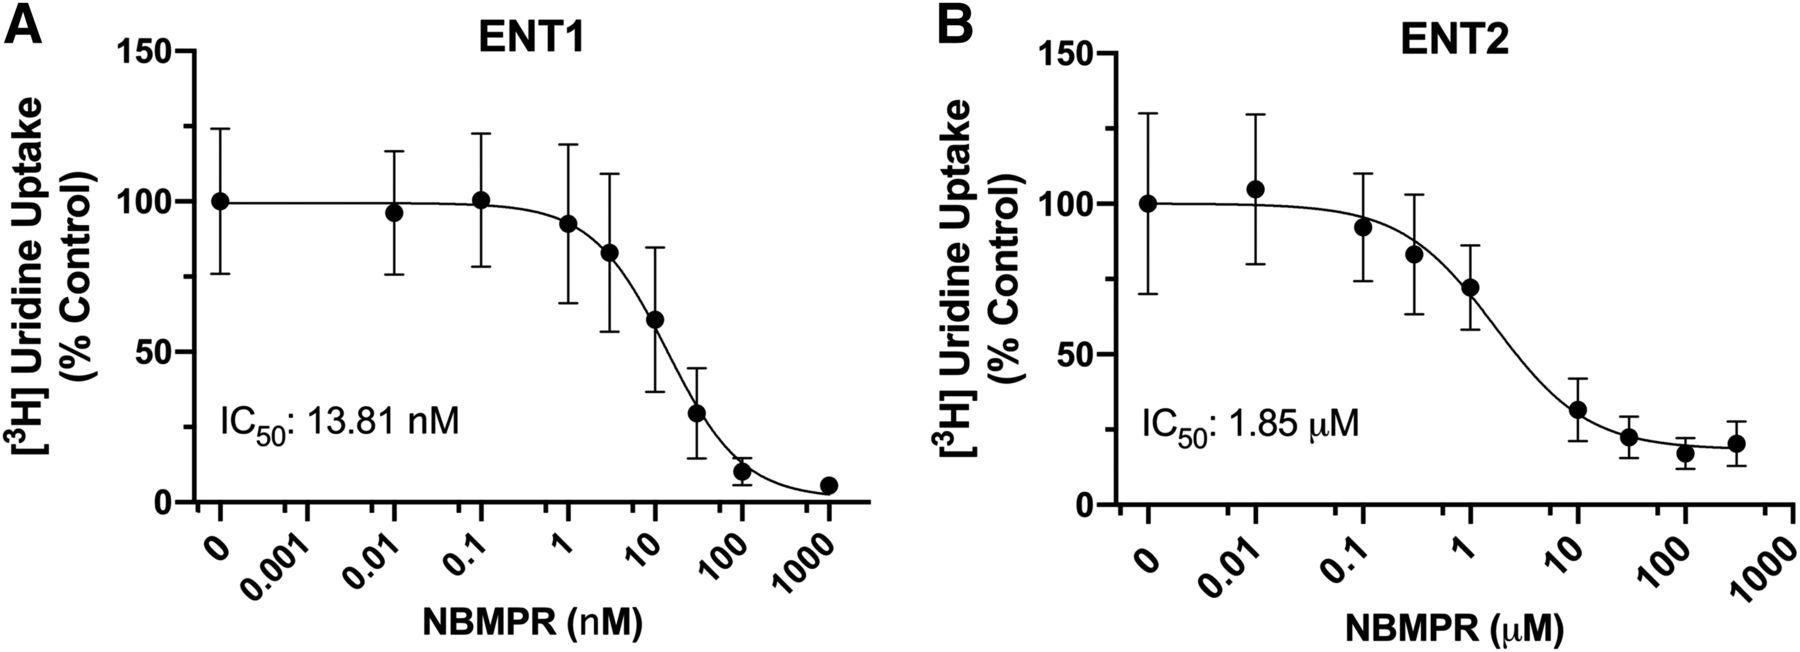
NBMPR IC50 curves in ENT1 (A) and ENT2 (B) cell lines. Approximately 20 nM [3H]uridine was incubated with increasing concentrations of NBMPR. Total accumulated [3H]uridine was measured after 2 minutes. Results were normalized to total accumulated [3H]uridine in the absence of NBMPR. Equation 2 was used to generate IC50 values for each experiment. Data are represented as mean ± S.D. with n = 3 in triplicate.
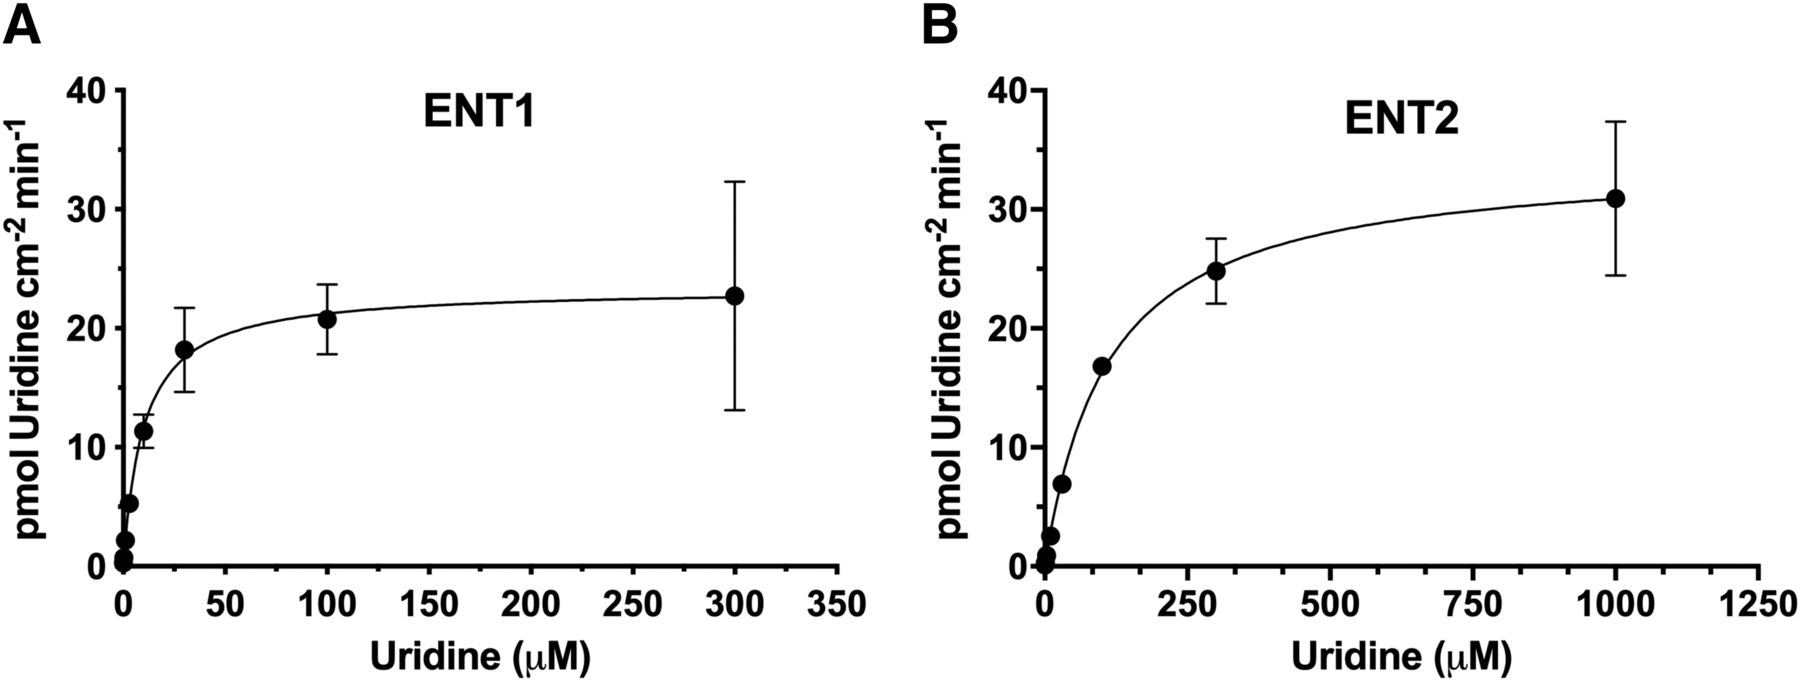
Kinetics of Uridine Transport.
[3H]uridine uptake was effectively linear for 7 minutes in wild-type HeLa cells and in the ENT1 and ENT2 cells (Miller et al., 2020). To determine uridine transport kinetics in each cell line, we evaluated [3H]uridine uptake after 2 minutes to estimate the initial rate of uptake. The Jmax for ENT1 was 23.8 ± 0.9 pmol·cm−2·min−1, and for ENT2 it was 44.9 ± 16.3 pmol·cm−2·min−1 (P = 0.089). The Kt for ENT1 was 13.8-fold lower than that for ENT2 (11.4 ± 3.9 and 156.9 ± 55.6 μM, P = 0.016) (Fig. 4; Table 1). The ratios of the kinetic parameters are also presented in Table 1.

Uridine kinetics in ENT1 (A) and ENT2 (B) cell lines. Twenty nanomolars [3H]uridine uptake in the presence of increasing amounts of unlabeled uridine was measured after 2 minutes. Michaelis-Menten kinetics (eq. 3) were used to generate kinetic parameters in Table 2. The nonsaturable component was subtracted from total accumulated [3H]uridine. Data are represented as mean ± S.D. with n = 3 in triplicate.
Kinetic parameters of ENT2 and ENT1 knockout cell lines
An unpaired t test was used to determine significance (P < 0.05). All data are represented as mean ± S.D. with n = 3.
Endogenous Nucleoside Interactions.
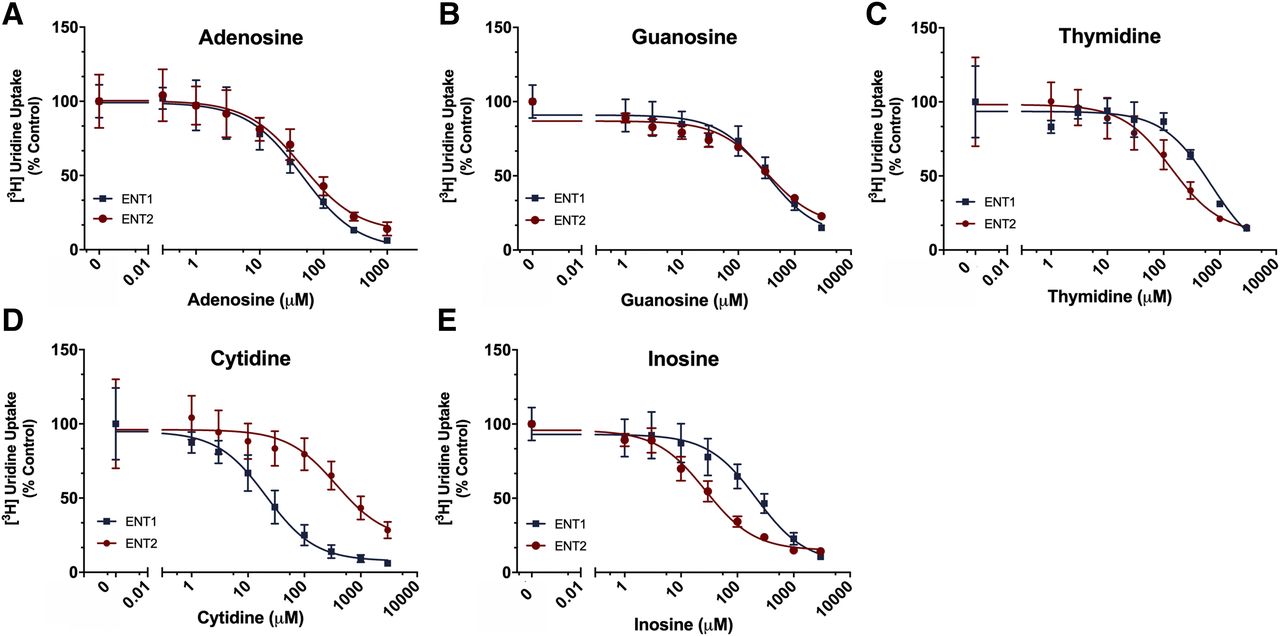
We examined the differences in inhibition of [3H]uridine uptake in the ENT1 and ENT2 cell lines determined in the presence of the endogenous nucleosides: adenosine, guanosine, thymidine, inosine, and cytidine (Fig. 5; Table 2). A best-fit line was generated from eq. 2 to generate IC50 values, and an extra sum-of-squares F-test (P < 0.05 indicating a statistical difference in IC50 values, P > 0.05 indicating no statistical difference in IC50 values) was used for comparison. For adenosine, the IC50 was 39.9 (95% CI: 24.5–65.14) μM for ENT1 and 56.5 (95% CI: 29.3–108.5) μM for ENT2 (P = 0.3767). For guanosine, the IC50 for ENT1 was 385.9 (95% CI: 194.4–780.5) μM and 254.9 (95% CI: 140.5–458.6) μM for ENT2 (P = 0.3582). The IC50 value for thymidine was 5.1-fold lower for ENT2 than ENT1: 138.1 (95% CI: 64.7–290.4) μM and 708.9 (95% CI: 368.6–1468.0) μM, respectively (P = 0.0014). The IC50 for inosine was 8.1-fold lower for ENT2 than ENT1 [27.0 (95% CI: 19.5–37.5) μM and 219.5 (95% CI: 113.1–426.4) μM, P < 0.0001]. The IC50 for cytidine was 17.5-fold lower for ENT1 than ENT2 [21.1 (95% CI: 12.2–36.7) μM and 368.2 (95% CI: 105.3–1338.0) μM, P < 0.0001]. The ratios of the IC50 values for ENT2 and ENT1 are shown in Table 2.

Endogenous nucleoside [3H]uridine uptake in ENT1 and ENT2 cell lines. Inhibition of [3H]uridine uptake in the presence of endogenous nucleosides in ENT1 (blue squares) and ENT2 (red circles) cell lines by Adenosine (A), Guanosine (B), Thymidine (C), Cytidine (D) and Inosine (E). Equation 2 was used to generate best-fit lines, and IC50 values are reported in Table 3. All data are represented as mean ± S.D. with n = 3 in triplicate.
IC50 values of endogenous nucleosides in ENT1 and ENT2 cell lines
Best-fit values from eq. 2 were compared using the extra sum-of-squares F-test to determine significance. IC50 values are represented as mean and 95% C.I. with n = 3. Significance is indicated next to the compound name on the table (**P < 0.001; ***P < 0.0001).
NRTI Interactions.
Nine NRTIs (abacavir, zidovudine, entecavir, zalcitabine, lamivudine, emtricitabine, didanosine, stavudine, and tenofovir disoproxil) (Fig. 6; Supplemental Table 1) were evaluated for their impact on [3H]uridine uptake. The selected NRTIs have molecular weights below 300 g/mol except tenofovir disoproxil. These NRTIs were tested at 100 μM, 300 μM, and 1 mM in Fig. 6 as previously described (Miller et al., 2020). Only abacavir inhibited [3H]uridine uptake at all three concentrations for both cell lines. Zidovudine inhibited uptake at 300 μM and 1 mM in both cell lines. Entecavir inhibited [3H]uridine uptake at 1 mM in ENT2 cells. Emtricitabine modestly inhibited uptake at all concentrations in ENT2 cells. Since abacavir was the most potent inhibitor of the nine NRTIs tested, we determined its IC50 for ENT1 and ENT2 (Fig. 8A). IC50 values of abacavir were 85.7 (95% CI: 34.2, 137.3) μM for ENT1 and 316.8 (95% CI: 113.3, 520.2) μM for ENT2 (P = 0.0056).

NRTI inhibition of [3H]uridine uptake in ENT1 and ENT2 cell lines. Approximately 20 nM of [3H]uridine uptake was incubated with 100 μM (red bars), 300 μM (blue bars), or 1 mM (white bars) of nine different NRTIs for 2 minutes with ENT1 (A) or ENT2 (B) cell lines. The black bar represents tracer 20 nM [3H]uridine only. Amount of [3H]uridine uptake was normalized to percentage of uptake in tracer-only condition. Ordinary one-way ANOVA with Bonferroni’s correction for multiple comparisons to a control column (i.e., [3H]uridine only) with three comparisons per family and *P < 0.05; **P < 0.01; ***P < 0.0001 was used.
Nucleoside/Heterocycle Analog Interactions.
Thirty-seven nucleoside/heterocycle analogs (Supplemental Table 2) were tested at 200 μM to evaluate their impact on [3H]uridine uptake (Fig. 7). This concentration was used to maximize the concentration of the compound used while still remaining below 2% DMSO (v/v) to prevent interference with transport. Seventeen compounds inhibited uptake in at least one cell line. For ENT1, estimated-IC50 values ranged from 4 to 209 μM, and for ENT2, estimated-IC50 values ranged from 23 to 441 μM. Nevirapine, ticagrelor, and uridine triacetate had different estimated-IC50 values for ENT1 and ENT2 (P = 0.0026, P = 0.0007, and P = 0.0013, respectively, Table 3). The ratios of the estimated-IC50 values for ENT2 and ENT1 are shown in Table 3. Using this method to estimate IC50 values, thymidine, inosine, and cytidine had differing values for ENT1 and ENT2 (P = 0.0152, P = 0.014, P = 0.0001, respectively) that reflected the results from full IC50 curves in Fig. 5. Full IC50 values were determined for nevirapine, lexibulin, clofarabine, and cladribine using eq. 2 (Fig. 8, B–E). Nevirapine inhibited 50% of [3H]uridine uptake for ENT1 at 166.8 μM (95% CI: −32.88 to 366.6) and 17.78 μM (95% CI: 2.83–32.73) for ENT2 (P = 0.011). Lexibulin inhibited 50% of [3H]uridine uptake for ENT1 at 16.49 μM (95% CI: 0.776–32.20) and 21.32 μM (95% CI: −2.24 to 44.89) for ENT2 (P = 0.722). Clofarabine inhibited 50% of [3H]uridine uptake for ENT1 at 31.48 μM (95% CI: 11.83–51.13) and 12.22 μM (95% CI: 2.53–21.91) for ENT2 (P = 0.051). Cladribine inhibited 50% of [3H]uridine uptake for ENT1 at 67.26 μM (95% CI: 28.10–106.40) and 40.15 μM (95% CI: 15.06–65.24) for ENT2 (P = 0.170).

Nucleoside/heterocycle analog inhibition of ENT-mediated [3H]uridine uptake in ENT1 (A) and ENT2 (B) cell lines. Structures are provided in Supplemental Fig. 1. Approximately 20 nM of [3H]uridine was incubated with 200 μM of 37 different nucleoside/heterocycle analogs (white bars) for 2 minutes in each cell line. The black bars represent 200 μM endogenous nucleosides, 100 nM NBMPR, and 100 μM NBMPR. Ordinary one-way ANOVA with Dunnett’s correction for multiple comparisons (P < 0.05 indicating a difference from control) was used for statistical analyses of these experiments. Significance is indicated by the compound name on the y-axis (*P < 0.05; **P < 0.01; ***P < 0.001). Data are represented as mean ± S.D from duplicate values with n = 3.
Estimated-IC50 values of nucleoside/heterocycle analogs that inhibited [3H]uridine uptake in ENT1 and ENT2 cell lines
Endogenous nucleoside estimated-IC50 values are also included. Values are ranked from lowest to highest in the ENT1 cells. IC50 values were generated from two data points: tracer only (0 μM) and 200 μM using eq. 4. A comparison of fits for the IC50 equation extra sum-of-squares F-test was done to compare the estimated-IC50 values for each cell line (*P < 0.05). Estimated-IC50 values are presented as mean and 95% C.I. with n = 3.
IC50 values of abacavir, nevirapine, lexibulin, clofarabine, and cladribine in ENT1 and ENT2 cell lines
Best-fit values from eq. 2 were compared using the extra sum-of-squares F-test. IC50 values presented as mean and 95% C.I. with n = 3 and significance denoted by *P < 0.05 and ** P < 0.01.

Inhibition of [3H]uridine uptake in the presence of abacavir (A), nevirapine (B), lexibulin (C), clofarabine (D), and cladribine (E) in ENT1 (red circles) and ENT2 (blue squares) cell lines. IC50 values are reported in Table 4. Data are reported as mean [3H]uridine uptake as a percentage of control (i.e., in absence of compound) ± S.D. with n = 3 in duplicate.
Transport Determination for Nevirapine, Lexibulin, Clofarabine, and Cladribine.
Accumulation of clofarabine, cladribine, nevirapine, and lexibulin was measured in the absence and presence of NBMPR and detected by LC-MS/MS (Fig. 9). A decrease in clofarabine uptake was detected in the presence of NBMPR in ENT1 and ENT2 cells (P = 0.026, P = 0.0482). Similarly, a decrease in cladribine uptake was detected in the presence of NBMPR in ENT1 and ENT2 cells (P = 0.0031, P = 0.0096). No change in nevirapine uptake in the presence of NBMPR was detected in ENT1 or ENT2 cells (P = 0.1502, P = 0.9691). No change in lexibulin uptake was observed in the presence of NBMPR in ENT1 cells (P = 0.1589), but an increase in uptake was detected in the presence of NBMPR in ENT2 cells (P = 0.0340).

Determination of transport for identified inhibitors of [3H]uridine uptake in ENT1 and ENT2 cell lines. Total accumulation of clofarabine (A and B), cladribine (C and D), lexibulin (E and F), and nevirapine (G and H) over 5 minutes measured in the absence and presence of 100 μM NBMPR in ENT cells detected by LC-MS/MS. Fifty micromolars lexibulin, clofarabine, and cladribine were used for both cell lines, and nevirapine was used for ENT2 cells. One-hundred micromolars nevirapine was used for ENT1 cells. Data are reported as mean ± S.D. with n = 3 in duplicate (*P < 0.05; **P < 0.01)
Assay Central Bayesian Models.
Bayesian models were generated for ENT1 and ENT2 using percent uptake of control (i.e., [3H]uridine uptake only) in the presence of 37 nucleoside analogs (200 μM), 5 mM uridine, 100 μM NBMPR, and five endogenous nucleosides (200 μM) for a total of 44 compounds in each model. Inhibitors were classified as “active” if uptake was reduced by at least 50%; there were 18 active compounds for ENT1 and 17 active compounds for ENT2. Both the ENT1 and ENT2 models (Fig. 10) performed similarly and produced high performance metrics. Receiver operator characteristic (ROC) scores exceeded 0.71, with recall and specificity metrics ranging from 0.69 to 0.77. For small data sets, these scores are acceptable. The truth tables below the ROC curves indicate the number compounds that were of true positive (predicted and are inhibitors), false positive (type 1 error; predicted to be inhibitors and were not), true negative (were not predicted and are not inhibitors), and false negative (type 2 error; were not predicted and were inhibitors). Additional statistics presented in Figs. 10 and 11 include 1) precision, 2) recall (sensitivity; i.e., true positive rate), 3) specificity (i.e., true negative rate), 4) F1 score, 5) κ, and 6) Matthews correlation coefficient (MCC) (i.e., overall model classification performance). Equations and descriptions for these parameters for model statistics are previously described (Cohen, 1960; Matthews, 1975; Carletta, 1996; Zorn et al., 2019). These common metrics for evaluating machine learning model performance indicate that future prospective predictions can be reasonably considered, as the internal predictive performance is better than random chance.

ROC graphs generated from Assay Central machine learning models for ENT1 and ENT2. The x-axis is the false positive rate, and the y-axis is the true positive rate. Bayesian models for ENT1 (A) and ENT2 (B). Models were created using the nucleoside/heterocycle analogs in Fig. 7 and endogenous nucleosides. Predictions were evaluated using a standard probability cutoff at 0.5, wherein a value greater than 0.5 was considered active. Compounds were further classified as active if the inhibition of uridine uptake was greater than 50%. Truth tables showing the number of false positive, false negative, true positive, and true negative inhibitors are included. Other statistical parameters including precision, recall, specificity, F1 score, κ, and MCC are defined.
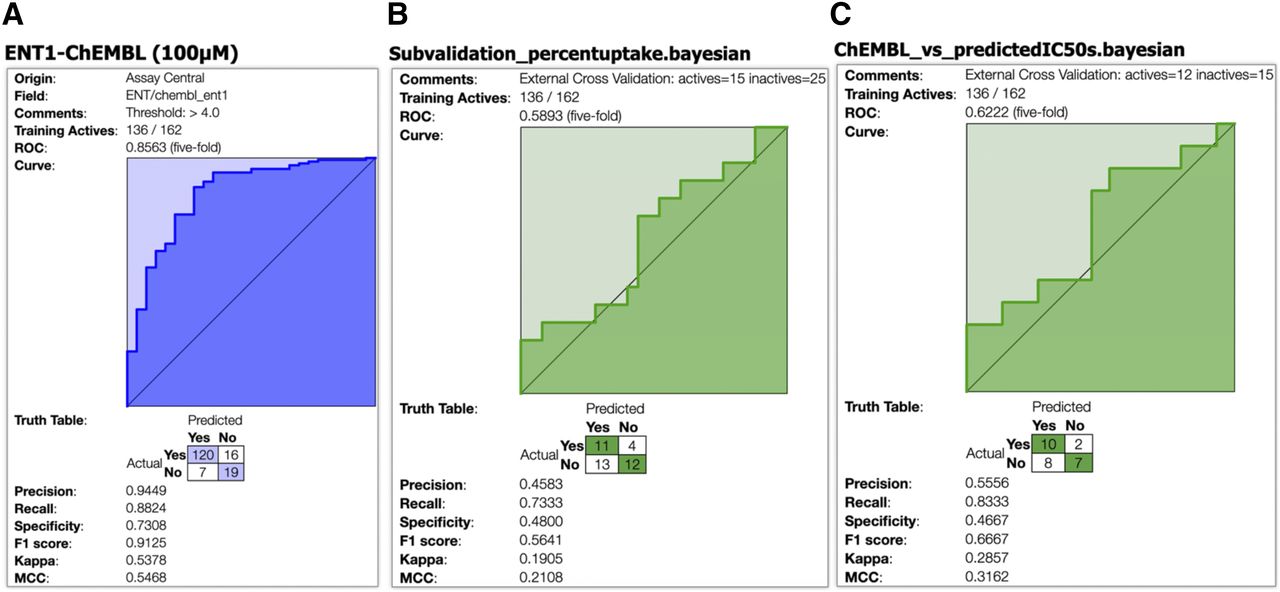
ROC graphs generated from Assay Central machine learning models for ENT1 using the ChEMBL data set. The x-axis is the false positive rate, and the y-axis is the true positive rate. The ENT1 training model (A) was built from all IC50 data available from ChEMBL Target ID 1997 (https://www.ebi.ac.uk/chembl/target_report_card/CHEMBL1997/), and the threshold was set at 100 μM. The percent uptake subvalidation (B) test was defined by binary classification of percent uptake <50% with 40 compounds total. The estimated-IC50 values subvalidation (C) test was defined by binary classification of estimated-IC50 values of less than 100 μM with 27 compounds total. Truth tables showing the number of false positive, false negative, true positive, and true negative inhibitors are included. Other statistical parameters including precision, recall, specificity, F1 score, κ, and MCC are defined.
External validation or Assay Central subvalidations were also performed for ENT1, in which test set compounds were classified as inhibitors if the prediction thresholds were above 0.5. The ENT1 training model was built from all IC50 data available from ChEMBL Target ID 1997, and the threshold was set at 100 µM (Fig. 11A).The estimated-IC50 values were calculated from the rates of transport measured in the absence of inhibitor and in the presence of 200 µM concentrations of a battery of test inhibitors compounds ([I]), i.e., J0 and Ji, respectively, using the eq. 4 (Kido et al., 2011; Sandoval et al., 2018). These calculated values are referred to as “estimated” IC50 values. The test set was composed of the 37 nucleoside/heterocycle analogs, endogenous nucleosides, and NBMPR and uridine, with percent uptake and estimated-IC50 data generated using eq. 4 using two points: [3H]uridine and 200 M of compound. Five compounds were in the training model (adenosine, [3H]uridine + 5 mM uridine, [3H]uridine + 100 nM NBMPR, [3H]uridine + 100 µM NBMPR, and tecadenoson), so they were removed from the test set. The individual predictions summarized in the truth table for each transporter test set have also been made available (Supplemental File 1). The first test set for ENT1 subvalidation (Fig. 11B) was defined by binary classification of percentage uptake less than 50%, totaling 40 compounds. The public training data set correctly predicted 58% of inhibitors. The second test set for ENT1 subvalidation (Fig. 11C) was defined by binary classification of estimated-IC50 values of less than 100 µM with 27 compounds total. In this case, the public training data set correctly predicted 63% of test set inhibitors.
Discussion
This study generated CRISPR/Cas9 functional knockouts of ENT1 and ENT2 in HeLa S3 cells with deletions in exon 5 and exon 1, respectively (Fig. 1A). In ENT1 cells, >96% of [3H]uridine uptake was mediated by ENT1 (Fig. 2A). In ENT2 cells, 90% of [3H]uridine uptake was mediated by ENT2 (Fig. 2B). The ENT1 cells showed approximately 2.4 times the ENT1-mediated [3H]uridine uptake observed in wild-type HeLa S3 cells when ENT activity was pharmacologically separated using NBMPR and 1.8 times the amount of total combined ENT1- and ENT2-mediated [3H]uridine uptake (Miller et al., 2020). The ENT2 cells showed approximately 1.4 times the observed ENT2-mediated [3H]uridine uptake in wild-type HeLa S3 cells (Miller et al., 2020). There were no differences in the growth rate of wild-type and ENT cells (Fig. 1C). We saw decreases in ENT1 and ENT2 mRNA expression for ENT2 cells and modest decreases in mRNA expression of ENT1 and ENT2 in ENT1 cells (Fig. 1D). Increase in [3H]uridine uptake may be attributed to increased protein expression or function of the remaining functional transporter. However, we have not been able to find reliable antibodies for ENT1 and ENT2 to assess this.
There was a 13.8-fold difference in the Kt for ENT1 and ENT2 that aligns with observations in wild-type HeLa S3 cells (reported Kt of 13.6 and 108.9 μM, respectively) (Miller et al., 2020). NBMPR inhibited ENT1 with over 100-fold higher affinity than ENT2, which complements previously reported values in our laboratory with wild-type HeLa cells and others using heterologous expression systems (Plagemann et al., 1978; Plagemann and Wohlhueter, 1984; Boleti et al., 1997; Ward et al., 2000; Miller et al., 2020). The data confirm that CRISPR/Cas9 functional knockout of natively expressed ENTs in HeLa cells results in transport activity of the remaining homology that retains quantitatively similar characteristics as those expressed in other natively expressing model systems.
In studies with endogenous nucleosides, cytidine had the highest affinity for ENT1, and inosine had the highest affinity for ENT2. Thymidine had a higher affinity for ENT1 than ENT2, whereas guanosine and adenosine did not have differences in affinity for each transporter, similar to previously reported values using wild-type HeLa cells and NBMPR (Miller et al., 2020). However, the authors did not observe a difference between the IC50 values of thymidine for ENT1- and ENT2-mediated [3H]uridine uptake (Miller et al., 2020). These knockout cell lines assisted with the differentiation of this parameter for thymidine and could assist in delineating ENT1 or ENT2 affinity for other compounds.
In our studies with nucleoside reverse-transcriptase inhibitors, abacavir inhibited both ENT1- and ENT2-mediated [3H]uridine uptake, whereas zidovudine, entecavir, and emtricitabine inhibited ENT2 at a lower concentration than ENT1. Abacavir and entecavir are both guanosine analogs; however, guanosine appears to be a relatively low-affinity substrate for both ENT1 and ENT2 (Miller et al., 2020). We previously reported that abacavir is an inhibitor but not a substrate of the ENTs, with entry into HeLa cells limited to diffusion (Miller et al., 2020). The IC50 values determined in the present study for abacavir against ENT1- and ENT2-mediated [3H]uridine uptake showed that abacavir has ∼3.7-fold higher affinity for ENT1 than ENT2.
We expanded our investigation into ENT-drug interactions by testing 37 nucleoside/heterocycle analogs. These compounds are structurally diverse and range in molecular weight from 225 to 735 g/mol. Seventeen compounds inhibited uptake in at least one of the cell lines: GS-9667, lexibulin, ticagrelor, GS-6620, darusentan, acalisib, GS-0938, GS-9191 uridine triacetate, clofarabine, cladribine, darunavir, nelarabine, nevirapine, eleclazine, mericitabine, and tecadenoson. Of the nucleoside/heterocycle analogs that inhibited uptake, 76% had a molecular weight over 300 g/mol. Of the nucleoside/heterocycle analogs that failed to inhibit uptake, 65% had a molecular weight below 300 g/mol. Based on this limited data set, it appears that inhibition of ENT activity correlates with increased molecular weight. GS-9667 was the most potent inhibitor of ENT1 (estimated IC50 = ∼4 μM), whereas GS-6620 was the most potent inhibitor of ENT2 (estimated IC50 = ∼14 μM). The large difference in affinity of ENT1 and ENT2 for NBMPR shows that these two homologous transporters (amino acid sequence identity of ∼45%) have markedly different selectivity profiles. Here, we found that three compounds, nevirapine, ticagrelor, and uridine triacetate, had different inhibitory profiles for ENT1 and ENT2. Nevirapine more potently inhibited ENT2 than ENT1, and ticagrelor and uridine triacetate were more potent inhibitors of ENT1 than ENT2 (Fig. 7 and Fig. 8B).
The ENTs are not included by the International Transporter Consortium (Giacomini et al., 2010), the US Food and Drug Administration (United States Department of Health and Human Services, 2017), or the European Medicines Agency (European Medicines Agency Committee for Human Medicinal Products, 2012) as transporter targets for unwanted DDIs. Nevertheless, their recommendation that unbound Cmax/IC50 ratios of ≥0.1 as indicators of potential unwanted DDIs suggests that interactions of ENT1 with abacavir [IC50 value of 85.7 μM and Cmax of 2.23–15.3 μM (Hervey and Perry, 2000)] produce a Cmax/IC50 of 0.026–0.179, suggesting it could contribute to unwanted inhibition of transport of endogenous nucleosides.
The initial screening of the nucleoside/heterocycle analogs only identifies interactions and does not determine whether these compounds are substrates or inhibitors of the ENTs. The classification of identified inhibitors of the ENTs was explored for nevirapine, lexibulin, clofarabine, and cladribine. Transport of these compounds with and without 100 μM NBMPR was measured and detected by LC-MS/MS. Compounds without a decrease in uptake in the presence of NBMPR were concluded to be inhibitors at the tested concentration. Compounds with a decrease in uptake in the presence of NBMPR were classified as substrates. A decrease in clofarabine and cladribine uptake in the presence of NBMPR suggests both compounds are substrates (and competitive inhibitors of uridine uptake) of both transporters. No change in nevirapine uptake in the presence of NBMPR suggests that nevirapine is a nontransported inhibitor of both ENT1 and ENT2. No change in lexibulin uptake in the presence of NBMPR in ENT1 cells was observed, suggesting it is a nontransported inhibitor of ENT1. An increase in uptake in ENT2 cells in the presence of NBMPR suggests that lexibulin is also a nontransported inhibitor of ENT2. Further investigation into compounds that interact with the ENTs will classify compounds as substrates or inhibitors and may reveal differences in substrate selectivity between ENT1 and ENT2.
We identified significant interactions with both ENT1 and ENT2 for clofarabine and cladribine, as have previous studies (King et al., 2006). Gemcitabine is a widely accepted substrate of the ENTs (Hammond et al., 1999; Santini et al., 2011; Vincenzi et al., 2017; Hioki et al., 2018; Kim et al., 2018). Although gemcitabine is a substrate, we observed modest inhibition of [3H]uridine uptake in the presence of gemcitabine, which was consistent with other reports of gemcitabine inhibition of [3H]uridine uptake (Shimada et al., 2015; Hioki et al., 2018). Trifluridine is a reported substrate of both ENT1 and ENT2, and we observed modest interactions with ENT1 and ENT2 (Takahashi et al., 2018). Interestingly, cytarabine did not inhibit ENT1 activity and slightly inhibited ENT2 activity, although cytarabine is a substrate of both transporters (Wiley et al., 1983; White et al., 1987; Clarke et al., 2006; Català et al., 2016). Modest interactions with azacitadine and ENT1 and with decitabine and ENT2 were identified, although previous studies report both compounds as substrates for both transporters (Damaraju et al., 2012; Hummel-Eisenbeiss et al., 2013; Arimany-Nardi et al., 2014).
Bayesian machine learning models have been successfully and widely used to predict chemical bioactivity and improve and facilitate the drug discovery process. Using the Assay Central software, we generated predictive Bayesian models for inhibitors of ENT1 and ENT2 (Lane et al., 2018; Russo et al., 2018; Zorn et al., 2019). These models of ENT1 and ENT2 inhibition performed well in 5-fold crossvalidation as demonstrated by internal ROC scores greater than 0.7. Subvalidations based on the ENT1 training model built from IC50 data available from ChEMBL show that the model successfully predicted the majority of compounds that interact with ENT1. Using percent uptake, 58% of the inhibitors were correctly identified, and using estimated-IC50 values, 63% of the inhibitors were correctly identified. Testing additional diverse compounds and generating true IC50 values for identified inhibitors of ENT1 and ENT2 will aid in improving the Bayesian models as tools for increasing the efficiency of drug development as well as contributing to the generation of quantitative pharmacophores for these transporters.
In conclusion, the CRISPR/Cas9 system was used to produce HeLa cell lines that functionally expressed either ENT1 or ENT2, which were used to evaluate the impact of therapeutically relevant nucleoside-based compounds on transporter function. Moreover, these cell lines were crucial for the generation of predictive models for drug interactions with ENT1 and ENT2. There were marked differences in ENT1 and ENT2 selectivity with abacavir, nevirapine, ticagrelor, and uridine triacetate. Machine learning models based on these results can predict probable inhibitory interactions with the ENTs. Additionally, determining the structural differences in substrates for both transporters is essential in order to develop BTB-permeable compounds using the ENT1-ENT2 transepithelial transport pathway. Focused drug design informed by machine learning models developed from substrate selectivity data has the potential to improve the disposition of drugs by ENTs to treat viral infections and cancer in the MGT.
Acknowledgments
We thank Gilead Sciences Inc. (Foster City, CA) for providing us with selected compounds and Bill Smith for advice and review of the manuscript. We also thank Alex M. Clark (Molecular Materials Informatics, Inc.) for Assay Central support .
Authorship Contributions
Participated in research design: Miller, Jilek, Jennings, Galligan, Foil, Zorn, Ekins, Wright, Cherrington.
Conducted experiments: Miller, Zhang, Hau, Jilek, Jennings, Foil, Zorn, Ekins.
Performed data analysis: Miller, Zhang, Hau, Jilek, Jennings, Foil, Zorn, Ekins, Wright.
Wrote or contributed to the writing of the manuscript: Miller, Zhang, Hau, Jilek, Jennings, Galligan, Foil, Zorn, Ekins, Wright, Cherrington.
Footnotes
- Received September 21, 2020.
- Accepted November 19, 2020.
This work was supported by National Institutes of Health National Institute of General Medical Sciences [Grant R01-GM123643], [Grant 1R-41GM131433-01A1] and [Grant R44-GM122196-02A1]; and National Institute of Environmental Health Sciences [Grants 5-P30-ES006694 and 2-T32-ES007091-36A1].
↵
 This article has supplemental material available at molpharm.aspetjournals.org.

Abbreviations
- ACN
- acetonitrile
- BTB
- blood-testis barrier
- Cas9
- CRISPR-associated protein 9
- DDI
- drug-drug interaction
- ENT
- equilibrative nucleoside transporter
- GAPDH
- glyceraldehyde-3-phosphate dehydrogenase
- GC
- guanine-cytosine
- gRNA
- guide RNA
- KO
- knockout
- LC-MS/MS
- liquid chromatography tandem mass spectrometry
- LyB
- lysogeny broth
- MCC
- Matthews correlation coefficient
- MGT
- male genital tract
- NBMPR
- S-[(4-nitrophenyl)methyl]-6-thioinosine
- NRTI
- nucleoside reverse-transcriptase inhibitor
- PCR
- polymerase chain reaction
- ROC
- receiver operator characteristic
- WB
- Waymouth’s buffer
- Copyright © 2021 by The American Society for Pharmacology and Experimental Therapeutics


